Stock Picks Bob's Advice
Tuesday, 21 March 2006
March 21, 2006 Phillips-Van Heusen (PVH)
Hello Friends! Thanks so much for stopping by and visiting my blog,
Stock Picks Bob's Advice. As always, please remember that I am an amateur investor, so please remember to consult with your professional investment advisors prior to making any investment decisions based on information on this website.

This afternoon, while looking through the
list of top % gainers on the NYSE, I came across Phillips-Van Heusen (PVH) which as I write is trading at $38.51, up $3.26 or 9.25% on the day. I do not own any shares nor do I have any options on this stock.

According to the
Yahoo "Profile" on Phillips-Van Heusen, the company
"...operates as an apparel company worldwide. The company designs and markets branded dress shirts, sportswear, footwear, and other related products, as well as licenses its brands for an assortment of products. Its sportswear products include men's knit and woven sport shirts, sweaters, bottoms, swimwear, boxers, and outerwear. The company’s footwear products include casual and dress casual shoes for men, women, and children, and apparel and accessories, such as handbags, belts, and travel gear, for men and women. The company’s licensed brands comprise Geoffrey Beene, Kenneth Cole New York, Reaction Kenneth Cole, BCBG Max Azria, BCBG Attitude, MICHAEL Michael Kors, Chaps, Sean John and, Donald J. Trump Signature Collection."
What drove the stock higher today was the
announcement of 4th quarter 2005 results after the close of trading yesterday. For the quarter ended January 29, 2006, revenues increased 11% to $460.1 million from $413.8 million in the prior year same period. Net income worked out to $22.9 million or $.41/share, which exceeded previous guidance by $.04/share. This was a 32% increase over the prior year's net income of $17.3 million or $.33/share. In addition, the raised guidance for 2006. In my book this is a 4/4 earnings report with: increased earnings, increased revenues, exceeding of guidance, and raising of guidance, all in the same report.

How about longer-term results?
Taking a look at the
Morningstar.com "5-Yr Restated" financials, we can see that the company was fairly stagnant between 2001 and 2003 when revenue slipped from $1.46 billion to $1.41 billion. Earnings also dropped from $1.10/share to $1.08/share in 2003 and $(.18)/share in 2004. However, since 2003, revenue has grown steadily and substantially to $1.86 billion, and earnings have improved from the loss in 2004 to $1.14/share in 2005 and $1.79 in the trailing twelve months (TTM).
Since 2001, the company has also paid a dividend, paying $.15/share each year. The company has been expanding its number of shares, a development that we should pay attention to, increasing from 27 million shares in 2001 to 31 million in 2005 and 42 million in the trailing twelve months.
Another big plus on this report is the free cash flow which although dropping from $76 million in 2003 to $24 million in 2004 has since increased strongly to $96 million in 2005 and $149 million in the TTM.

Looking at the balance sheet on Morningstar.com, we can see that the company is reported to have $170.3 million in cash and $473.5 million in other current assets for a total of approximately $614 million. Compared to the current liabilities of $217 million, this works out to a 'current ratio' of almost 3. The company also has an additional $943.1 million in Long-Term liabilities.
What about some valuation numbers on this stock?
Reviewing the
Yahoo "Key Statistics" on Phillips-Van Heusen, we can see that this is a mid-cap stock with a market capitalization of $1.63 billion. The trailing p/e is a reasonable 23.80 with a forward p/e (fye 30-Jan-07) of 17.78. The PEG works out to 0.95.
Examining the
Fidelity.com eResearch website, we can see that this company is in the "Textile-Apparel Clothing" industrial group. Topping the group relative to the Price/Sales ratio is BEBE Stores (BEBE) with a ratio of 3, followed by Columbia Sportswear (COLM) at 1.8, then Phillips-Van Heusen (PVH) and VF Corp (VFC) at 1.0, and Hot Topic (HOTT) at 0.9, and Quiksilver (ZQK) at 0.9. Thus valuation by this parameter looks pretty reasonable as well.
Finishing up with Yahoo we find that there are 42.33 million shares outstanding with 36.52 million that float. Of these, 1.82 million shares are out short representing 5.2 trading days of average volume (the short ratio). Thus, with an announcement of good news today, and a sharp move higher, one can only speculate about a 'squeeze' of the shorts resulting in additional buying pressures.
As noted above, the company does pay a small dividend of $.15/share yielding 0.40%. The last stock split reported on Yahoo was more than 14 years ago when the stock split 2:1 in October, 1991.
What about a chart?
Looking at a
"Point & Figure" chart on Phillips-Van Heusen (PVH) from StockCharts.com:
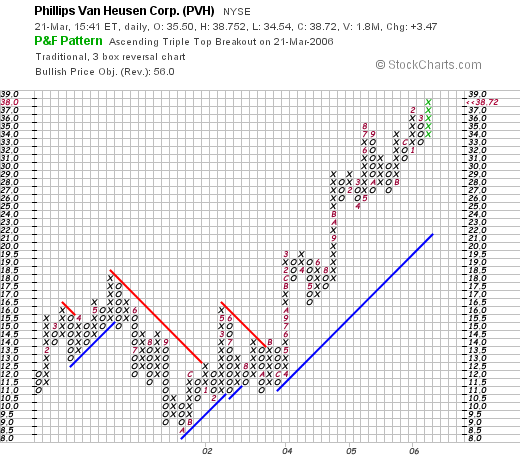
We can see that this stock also floundered in price between January, 2001, when the stock was at $11.00/share, until October, 2001, when the stock bottomed at $8.50. Since then, the stock has been climbing fairly steadily, breaking through resistance in October, 2003, at $13, and steadily moving to the current level at $38.72 today. The chart looks nice to me.
So what do I think? Well, I like this stock. The earnings report was solid, fulfilling the four things I like to see in a report: increase earnings, increased revenues, the exceeding of guidance in the quarter and the raising of guidance going forward.
The Morningstar.com report, while not perfect, shows a very nice improvement in results the past few years. Free cash flow is solid and growing. The company pays a small dividend, and valuation is nice with a PEG under 1.0, and a Price/Sales at 1.0 which was on the lower end of its group. In addition, the chart looks nice.
On a negative note, the company is issuing new shares and has a bit of a significant long-term debt. However, this appears to be related to acquisitions which appear to be managed successfully.
Now, if only I had the permission to be buying a new stock! Thanks so much for stopping by! If you have any comments or questions, please feel free to leave them on the blog or email me at bobsadviceforstocks@lycos.com.
Bob
Monday, 20 March 2006
A Reader Writes "And what are some basic principals you go by when picking stocks?"
Hello Friends! Thanks so much for stopping by and visiting my blog,
Stock Picks Bob's Advice. As always, please remember that I am an amateur investor, so please remember to consult with your professional investment advisors prior to making any investment decisions based on information on this website.
One of my favorite activities on this blog, is to receive and respond to letters regarding investing, stock picks, suggestions, critiques, and words of support. If you have any comments or questions please feel free to email me at bobsadviceforstocks@lycos.com.

Last week I received a letter from Ryan who wrote about my investment philosophy. He wrote:
"Hi Bob,
What stocks do you currently hold. And what are some basic principals you go by when picking stocks. I'm relatively new to the stock market. Thanks.
Ryan"
Let me answer your question in two parts. First of all, in the interest of transparency, I would like to briefly go over my holdings; I try to review one of my holdings each weekend in my "Trading Portfolio Analysis" entries.
As of March 20, 2006, my current trading consists of 21 stocks: Barnes Group (B) 180 shares, Dynamic Materials (BOOM) 200 shares, Coach (COH) 102 shares, Cytyc (CYTC) 225 shares, Genesco (GCO) 200 shares, Helix Energy (HELX) 142 shares, Hibbett Sporting Goods (HIBB) 84 shares, Healthways (HWAY) 128 shares, JLG Industries (JLG) 160 shares, Jos A Bank (JOSB) 187 shares, Kyphon (KYPH) 150 shares, Morningstar (MORN) 167 shares, Packeteer (PKTR) 400 shares, Quality Systems (QSII) 44 shares, Resmed (RMD) 180 shares, Starbucks (SBX) 59 shares, SRA International (SRX) 320 shares, St Jude (STJ) 180 shares, Sybron Dental (SYD) 113 shares, Meridian Bioscience (VIVO) 210 shares, and Ventana Medical Systems (VMSI) 225 shares.
I will continue to try to get in review weekly on each of these positions.
Your second question is about how I go about and pick stocks. I tried to answer this on an earlier podcast but let me once again try to put down my investing philosophy and strategy a little more clearly.
Some of the questions that need to be addressed include how do I pick stocks, when do I actually buy new positions, when I sell stocks, and how do I manage to adjust my portfolio to changing investment environments. In other words, do I have a mechanism of moving into stocks when times are good, and move into relatively more cash when times are bad.
First on picking stocks. Almost every day you can find me at some time looking through the lists of top % gainers in the market. I emphasize NASDAQ stocks, which seem to have the fastest growing companies, next review NYSE issues and last, take a look at the AMEX stocks. I have a couple of idiosyncratic things that I like to do, which includes avoiding financial stocks which need to be evaluated in an entirely different fashion, and generally staying with stocks that are $10 or greater.
From this list of top % gainers, I generally open up my Morningstar.com "5-Yr Restated" financials page. On the Morningstar.com page, I check for some evidence of
persistence of results, you could say financial 'momentum', that is, I look for steady revenue growth. A trend towards earnings improvement (making sure the company is profitable), and positive and hopefully growing free cash flow. Other facts that I examine, but are not necessarily necessary for a pick, is the presence of a dividend that ideally would be increasing as well. Furthermore, it is important to make sure that the number of shares outstanding is stable or even decreasing.
My review of the balance sheet includes evaluating the relative balance between the current assets and the current liabilities. This is called the "current ratio" which at least is 1.5 or greater. I like to look at the relative ability of the combined current assets to pay off both the current liabilities and the long-term liabilities combined. This is an extra "plus" in my review.
Next step is to look at the latest quarterly result. I insist on growth in both earnings and revenue in the latest quarter. Additional positive findings for me include whether the company has exceeded 'expectations' and whether the company raises guidance for future quarters.
In my review, I like to go next to the "Key Statistics" page on Yahoo finance. There I look at the size of the company (the market cap), the P/E, and the PEG ratio. The more reasonable these numbers are (a PEG under 1.5 is preferred) the more attractive I find a stock.
Using Fidelity.com, I try to compare the Price/Sales ratio to other stocks in the same industrial group. Hopefully, this also shows good 'value'.
Going back to Yahoo, I am interested in knowing the number of shares out short relative to the average trading volume of the stock (the short ratio). If there are a lot of shares out short (over 3.0 trading days), this is significant in a positive fashion imho, suggesting a possible short 'squeeze'.
Finally, I look at a point and figure chart to assess whether the stock generally appears to have price momentum. Simply put, does the chart look like the stock is moving higher, lower, or going nowhere.
I would like to briefly comment on my portfolio management. First of all, I would suggest starting a portfolio in "neutral". Which from my perspective means 50% in cash and 50% in equities. I believe an investor should know the maximum number of positions he/she would like to hold in their own portfolio. If one has goal of 20 positions, start at 10, drop down to 5 in a bearish environment, and go to a maximum 20 positions in a bull market.
I believe in allowing my own stocks to determine whether I am moving into cash or equities. Once at a maximum number of positions, all sales on good news go into cash. Otherwise, when I sell on "bad" news, I like to sit on my hands, so to speak, moving my portfolio towards cash. Good news for me is a partial sale on a targeted gain. This is my permission slip to add a new positions moving me closer to a maximum # in my portfolio.
Bad news consists of sales after either announcements of fundamental problems with a company, or declines in a stock price moving to a sale target. After a first purchase, I sell on an 8% loss. Otherwise after one sale on good news, I sell at break-even. After two or more sales on good news, I sell at 50% of the highest sale percentage gain.
Good news sales are at set intervals. I sell 1/6th of my holding at 30%, 60%, 90%, 120%, then by 60% intervals x 4, then by 90% intervals by 4, etc. These sales allow me to add a new position.
When I sell on bad news, I sit on my hands waiting for a sale on good news to replace that position. My only exception would be when I have reached my minimum # of positions.
Now that was a mouthful! I hope that clarifies my strategy. If you have any questions or comments, please feel free to leave them on the blog or email me at bobsadviceforstocks@lycos.com.
Bob
Sunday, 19 March 2006
"Looking Back One Year" A review of stock picks from the week of December 27, 2004

Hello Friends! Thanks so much for stopping by and visiting my blog,
Stock Picks Bob's Advice. As always, please remember that I am an amateur investor, so please remember to consult with your professional investment advisors prior to making any investment decisions based on information on this website.
One of the weekend tasks that I like to accomplish on the blog is to review picks from a year earlier. Last week I reviewed picks from December 20, 2004, this week, I am up to December 27, 2004. This analysis assumes a buy and hold strategy. In reality, I advocate and practice a more disciplined approach of selling losing stocks quickly and completely, and gaining stocks slowly and partially. Implementation of a strategy like this would result in actual results different than this review. However, for the sake of simplicity, this method gives us an overall idea of the stock performance.
Furthermore, this review is limited to a check of the current stock price and the latest quarterly earnings report. I give each stock a thumbs up or a thumbs down based on whether the latest earnings report demonstrates both increased revenue and earnings (thumbs up) otherwise the stock is given a 'thumbs down'.

On December 30, 2004, I
posted Dialysis Corporation of America (DCAI) on Stock Picks Bob's Advice when it was trading at $19.21. DCAI closed at $12.78 on 3/17/06, for a loss of $(6.43) or (33.5)%.

On February 13, 2006, DCAI
reported 4th quarter 2005 results. Operating revenues came in at $12.2 million, up from $11.8 million in the same quarter last year. Net income for the quarter was $594,000 or $.06/diluted share, compared with $762,000 or $.08/diluted share the prior year.

On December 31, 2004, I
posted Laserscope (LSCP) on Stock Picks Bob's Advice when it was trading at $35.99. LSCP closed at $21.01 on 3/17/06, for a loss of $(14.98) or (41.6)% since posting.

On February 23, 2006, Laserscope
reported 4th quarter 2005 results. Revenue for the quarter ended December 31, 2005, came in at $35.0 million, a 19% increase over fourth quarter 2004 revenue of $29.4 million. Net income for the quarter grew to $5.9 million or $.26/diluted share, compared with net income of $5.2 million or $.23/diluted share last year during the same period.
So how did we do during this week a little over a year ago. As is sometimes the case,
both of the stocks declined for an average loss of (37.6)%.
The evaluation shows that there is nothing magical about my stock picks. I do not bat 1.000, and sometimes the stock "picks" decline. Overall, I think that the picks on this blog have done quite well. But the possibility for loss must always be considered. Thus the need for loss limits like the 8% loss limit I utilize myself.
Thanks so much for stopping by! If you have any questions or comments, please feel free to email me at bobsadviceforstocks@lycos.com or simply leave your comments on the blog.
Bob
Friday, 17 March 2006
Readers Write About Buying and Selling Stocks
Hello Friends! Thanks so much for stopping by and visiting my blog,
Stock Picks Bob's Advice. As always, please remember that I am an amateur investor, so please remember to consult with your professional investment advisors prior to making any investment decisions based on information on this website.
Checking my email, I had two messages from readers (and listeners) who asked me about buying and selling issues. Let me share with you their letters and address some of the issues they raise.
First, Bob K., a friend of mine, wrote a nice letter. He wrote:
"Hi Bob,
VTIV is getting a lot of attention. I bought some back in August and is up over 36%. Thanks for reviewing it. I wonder if it is time to add to this position. I know it is approaching your sell range but it occurs to me that had you not noticed it in August, would you notice it now? To put it another way, is there ever a time to add to a position with your strategy? Thanks and keep up the good work!
Bob"
Well, first of all thank you for writing! And I am glad that the problem that we are dealing with is dealing with a gain and not a loss! But what to do?
As I wrote you, and as I am sure you expected, I told you that I don't 'average-up' or buy more of stocks as they appreciate in price. I know that many CANSLIM investors, and others, do practice this technique. And in a stock that is climbing, it isn't necessarily a bad idea. In other words, if that is what you would like to do, then go ahead!
My own strategy involves the simple philosophy of selling my losing stocks quickly and completely and selling my gaining stocks slowly and partially. When one of my stocks appreciates, such as your holding in VTIV (I don't own any shares of Ventiv personally), then I would be selling 1/6th of that position, and using that sale as a signal to purchase a
new position.
As I pointed out to you, I am going for base hits. Lots of them. That doesn't mean that I don't swing for the fences :). It just means that I want to have a portfolio where I am selling lots of shares at gains and selling few at losses.
Will I lose out on some of the strongest stocks that way? You bet. I will also avoid the problem of a stock climbing, failing to sell anything, and then later collapsing in price. Unfortunately that is also a more than rare occurrence.
I hope that helps you out. You knew, I am sure, what I would say. But you wanted to make me say it anyhow I guess :). Doesn't mean that if you should purchase some more of VTIV that it would be a wrong decision. Just not what I do.
I had another letter about selling stocks.
Bill S. wrote:
"Hi Bob,
I really enjoy your podcast, and I think you do a nice job of analyzing stocks in an informative and entertaining way. From what I heard you say, you've been an investor for quite a while. My question is this: How do you think about or handle taxes and commissions when trading stocks? I have been investing for about a year now, and have been doing well. I tend to hold stocks as long as things are positive from a fundamental and technical view-usually a few months. I also try to limit myself to about 6 trades (buying and selling combined) per month. The one thing I still struggle with is knowing how much I am making during the course of the year, and making decisions about getting out of a stock with a smallish gain dollar wise (say under $150) with a short term gain. I often hear to just ignore the "tax man" when buying and selling. Do you have any guidance as to how to handle these issues? Thanks!
Sincerely,
Bill"
If you follow my blog, you will know that I don't make too many trades. Maybe just one or two a month on the average. But in any case, I try to make trades because my trading system dictates that decision for me.
Since I am selling stocks quickly if they hit an 8% loss, these short-term losses should cover the short-term gains. Most of my gains, stay in my account. My un-realized gains far exceed my realized, or taxable transactions.
I don't really pay much attention to the cumulative gains or losses at any particular time. Again, I am trading based on trading rules. Of course, I shall be paying taxes on my capital gains. As my dad would always tell me, I hope that I eventually have to pay LOADS of taxes on gains. I can deal with that kind of success.
One approach to consider if you are anxious to avoid taxes on gains, is to have an IRA with stocks that you are more aggressive with. In other words, as long as the trades are within the IRA account they won't be taxable events as I understand it. However, you won't be able to deduct any losses either.
My overall advice is to pay attention to your trading discipline to maximize the performance of your account. I view tax issues as extraneous and pressures that may keep you from making the right decisions about holding stocks.
My approach may not be suitable for you and you might wish to trade less frequently. There isn't anything wrong with that at all. As far as know how you are doing that year, my Fidelity account gives me a cumulative short-term and long-term gains and losses statement. If your brokerage account doesn't provide this information easily for you, you might wish to explore other brokerage services.
Good luck and let me know how things work out for you1 Again, thanks for writing, and thanks for listening to my podcast. If you or anyone else has other questions or comments, please feel free to leave them on the blog or email me at bobsadviceforstocks@lycos.com.
Bob
March 17, 2006 CLARCOR (CLC)
CLICK ***HERE*** for my PODCAST ON CLARCORHello Friends! Thanks so much for stopping by and visiting my blog,
Stock Picks Bob's Advice. As always, please remember that I am an amateur investor, so please remember to consult with your professional investment advisors prior to making any investment decisions based on information on this website.

I was looking through the
list of top % gainers on the NYSE this afternoon, and came across CLARCOR (CLC) which as I write, is trading at $35.62, up $1.56 or 4.58% on the day. I do not own any shares of this company nor do I have any options.

According to the
Yahoo "Profile" on CLARCOR, the company
"...provides filtration products worldwide. It has three segments: Engine/Mobile Filtration, Industrial/Environmental Filtration, and Packaging."
On January 18, 2005, CLARCOR
reported 4th quarter 2005 results. For the quarter ended 12/3/05, net sales came in at $241.5 million, a 16.4% increase over the $207.5 million reported in the same quarter the prior year. Net earnings worked out to $25.0 million, up 16.2% from the $21.5 million reported the year earlier. On a diluted earnings per share basis this was $.48/share, up 14.3% from the $.42/share reported the year earlier.
How about longer-term results?
Reviewing the
Morningstar.com "5-Yr Restated" financials on CLARCOR, we can see the steady increase in revenue from $667 million in 2001 to $874 million in 2005.
Earnings, likewise, have not 'missed a beat' growing steadily from $.84/share in 2001 to $1.46/share in 2005. The company does pay a dividend, which has been increased from $.24/share in 2001 to $.26/share in 2005. The number of shares outstanding is relatively stable with 49 million shares in 2001, increasing to 52 million shares in 2005.
Free cash flow is positive and steady with $75 million reported in 2003, and $65 million in 2005.
The balance sheet as reported by Morningstar looks solid with $28.9 million in cash and $296 million which when compared to the current liabilities of $121.5 million yields a 'current ratio' of almost 3. In fact, the combined current assets is enough to completely pay off the current liabilities of $121.5 million and the $71.0 million in long-term liabilities combined and still have over $130 million left over.
How about some valuation numbers on this stock?

Reviewing the
Yahoo "Key Statistics" on CLARCOR, this is a mid-cap stock with a market capitalization of $1.84 billion. The trailing p/e is a moderate 24.35, with a forward (fye 30-Nov-07) p/e of 20.72, giving us a PEG of 2.18.
According to the
Fidelity.com eResearch website, CLARCOR is in the "Auto Parts" industrial group and is priced at the top of the group with a Price/Sales ratio of 2.0. This is followed by BorgWarner (BWA) at 0.8, Magna International (MGA) at 0.4, American Axle (AXL) at 0.2,and Lear (LEA) at 0.1.
Reviewing some additional Yahoo information, the company has 51.77 million shares outstanding with 50.69 million that float. Of these, 1.52 million (as of 2/10/06) are out short representing 3.2% of the float or 6.2 days of average trading volume. Anything over 3 days is significant imho, and thus, at 6.2, may be contributing to the continued price rise in the stock.
As noted earnlier, the company does pay a small dividend of $.27/share yielding 0.80%. The company split its stock last year, having declared a 2:1 split May 2, 2005.
How about a chart?
Looking at the
"Point & Figure" chart for CLARCOR from StockCharts.com:
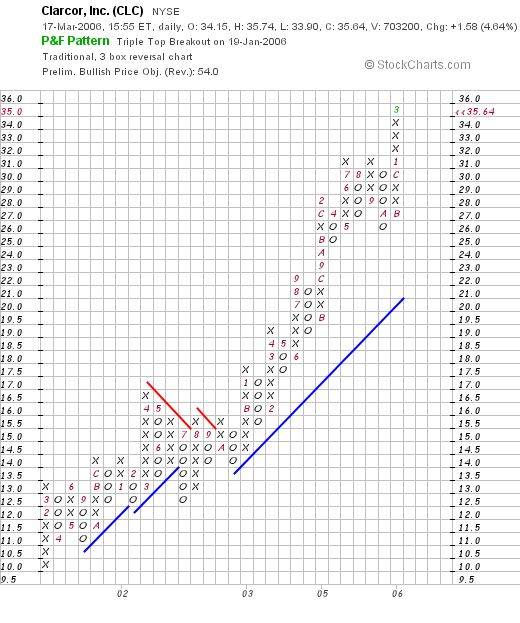
We can see how the steady revenue and earnings growth of this company has resulted in a steady and sustained price appreciation from $10/share in February, 2001, to the current $35.64 level. This is a very strong stock chart imho!
So what do I think? Well, if I did have the 'permission' to purchase a new positions, this stock would be quite tempting! I like the latest quarterly report, the five-year on Morningstar shows consistent revenue and earnings growth, free cash flow is positive if not growing, and the balance sheet looks great.
On the downside, the PEG is over 2.0 and the Price/Sales at 2.0 is the highest in its industrial group. Otherwise, the chart is solid and the steadiness of the company is quite impressive.
Thanks so much for stopping by and visiting. If you have any comments or questions, please feel free to leave them on the blog or email me at bobsadvicefrostocks@lycos.com.
Bob
Posted by bobsadviceforstocks at 3:20 PM CST
|
Post Comment |
Permalink
Updated: Friday, 17 March 2006 11:49 PM CST
Wednesday, 15 March 2006
LMI Aerospace (LMIA)
Click ***HERE*** for my PODCAST on LMI AEROSPACEHello Friends! Thanks so much for stopping by and visiting my blog,
Stock Picks Bob's Advice. As always, please remember that I am an amateur investor so please remember to consult with your professional investment advisors prior to making any investment decisions based on information on this website.

Looking through the
list of top % gainers on the NASDAQ today, I came across LMI Aerospace (LMIA) which closed at $18.01, up $1.86 or 11.51% on the day. I do not own any shares nor do I have any options on this stock.
According to the
Yahoo "Profile" on LMIA, the company
"...engages in fabricating, machining, finishing, and integrating aluminum and alloy components, and sheet metal products for use by the aerospace, technology, and commercial sheet metal industries."
The company
reported 4th quarter 2005 results on March 13, 2006. For the quarter ended December 31, 2005, sales came in at $28.8 million, up 28% from $22.5 million in the same quarter last year. Net income for the quarter came in at $2.0 million or $.23/diluted share, compared with $669,000 or $.08/diluted share for the same quarter in 2004. The company announced guidance for revenue in the $125 to $137 million range.
What about longer-term results?
Reviewing the
Morningstar.com "5-Yr Restated" financials on LMIA, we can see the fairly steady growth in revenue from $55.7 million to $85.9 million in 2004 and $94.7 million in the trailing twelve months (TTM). With the guidance of $125 to $137 million in 2006, we can see the continued growth of this small company.
Earnings, like so many small companies, has been erratic, with $(.16)/share reported in 2000, climbing to $.36/share in 2001 and dropping to a loss of $(1.03)/share in 2002. The company turned positive again at $.05/share in 2004 and has been improving strongly since.
Similarly, free cash flow which was a negative $(4) million in 2002, improved to break-even in 2003 and $6 million in 2004 and $5 million in the TTM.
The balance sheet is strong. Even though the company has only $100,000 in cash, Morningstar.com reports $41.6 million in other current assets. Balanced against the $13.2 million in current liabilities, this gives us a 'current ratio' of over 3.0. In addition, the combined current assets of $41.7 million is more than enough to pay off
both the $13.2 million in current liabilities and the $17.9 million in long-term liabilities combined.
What about some statistics on this company? Reviewing the
Yahoo "Key Statistics" on LMIA, we can see first of all that this is a very small company with a market cap of only $149.85 million. The trailing p/e is moderate at 38.81, but recall that the company is just starting to produce profits, and was otherwise losing money until recently. No PEG is reported, presumably because there aren't any analysts (?) out there, at least that Yahoo is reporting, with estimates on this company.
According to the
Fidelity.com eResearch website, the company is in the "Aerospace/Defense Products/Services" industrial group. Within this group, the company is priced midway relative to the Price/Sales ratio. Topping this list is Rockwell Collins (COL) with a Price/Sales ratio of 2.6. This is followed by a group of companies topped by LMI Aerospace (LMIA) at 1.4, Orbital Sciences (ORB) at 1.3, DRS Technologies (DRS) at 1.1, EDO Corp (EDO) at 1, and Alliant techsystems (ATK) at 0.9.
Returning to Yahoo for some other numbers, Yahoo reports only 8.32 million shares outstanding with 3.97 million of them that float. As of 2/10/06, there were only 8,220 shares out short representing 0.1 days of trading volume (the short ratio). This short interest does not look significant to me. Yahoo reports no dividends and no stock splits.
What about a chart?
If we review a
"Point & Figure" chart from StockCharts.com on LMIA:
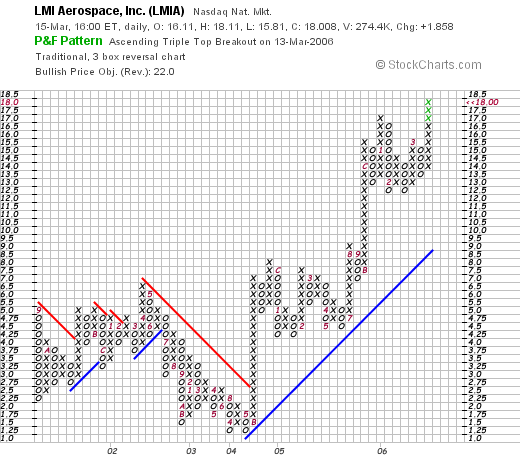
We can see that the stock was actually trading lower between 2001 when it was as high as $5.00, down to a low of $1.25 in May, 2004. The stock has broken through resistance at $2.25 and has moved strongly higher since. The chart is actually very bullish and looks strong to me!
So what do I think? This is a small company with a very nice recent quarterly report, a relatively solid Morningstar evaluation, and relatively reasonable valuation. I don't know the business, I don't know the management, but from the available information, the company is attractive for consideration! Due to the small market cap, this stock is likely to be very volatile in price, but if I were in the market to be buying a stock, I just might be nibbling on this one!
Thanks so much for stopping by and visiting my blog! If you have any comments or questions, please feel free to leave them right below the entry or email me at bobsadviceforstocks@lycos.com.
Bob
Posted by bobsadviceforstocks at 5:13 PM CST
|
Post Comment |
Permalink
Updated: Wednesday, 15 March 2006 10:34 PM CST
Monday, 13 March 2006
Stryker (SYK) Revisiting a Stock Pick
Hello Friends! Thanks so much for stopping by and visiting my blog,
Stock Picks Bob's Advice. As always, please remember that I am an amateur investor, so please remember to consult with your professional investment advisors prior to making any investment decisions based on information on this website.

I received an email from a new investor who asked me about how I go about picking stocks and what stocks are in my trading portfolio. I will answer the latter part elsewhere but I would like to use this "stock pick" to explain my thinking and my process in selecting stocks for consideration for investment. Please always remember that I truly
AM an amateur, so realize that there are probably many better ways to select stocks. Be that as it may, let me share with you my own perspective!
My first place I go in my 'search' for new ideas is the list of top % gainers. I have been using the money.cnn.com website, and today, looking through the
list of top % gainers on the NYSE, I came across Stryker (SYK), which, as I write, is trading at $48.07, up $1.73 or 3.73% on the day. Why Stryker? For one thing, this is a name that is familiar to me having reviewed it previously. In fact, I
posted Stryker (SYK) on Stock Picks Bob's Advice on July, 19, 2004, when it was trading at $47.95, virtually unchanged (!) from today's price.
I actually check many different stocks before settling on a particular stock to discuss. I will try to concentrate on NYSE and NASDAQ issues, but will also look at the AMEX for possibilities at times. Beyond staying with stocks that are near to or higher than $10, I try to look at new names that I haven't heard of before as well as old favorites. By the way, I do not own any shares nor do I have any options on Stryker.
Since many of the stocks are companies I have never even heard of before (!), I start with the Yahoo "Profile" to get a feel for the stock. This is the
Yahoo "Profile" on Stryker, informing me that the company
"...engages in the development, manufacture, and marketing of orthopedic products and medical specialties worldwide. It operates in two segments, Orthopedic Implants and MedSurg Equipment."
Even though I discuss the latest quarter at this point, quite frankly, when looking for stocks, I jump to the Morningstar.com page for the "5-Yr Restated" financials. I eliminate a lot of ideas after looking at Morningstar.
Looking at the
"5-Yr Restated" financials from Morningstar.com on Stryker, my first analysis is the revenue growth record. I am looking for a company, simply put, that shows a record of increasing revenue for at least the last three or four years. In this case, we can see graphically, looking at the series of increasing 'purple bars' on the bar graph, that Stryker has
consistently been reporting growth in revenue from $2.29 billion in 2000 to $4.26 billion in 2004 and $4.75 billion in the trailing twelve months (TTM).
What about the earnings? Looking at the same page a few lines lower, Morningstar reports the earnings results on a per share basis, and this company 'passes the test'. Stryker earned $.55/share in 2000, and has increased its earnings regularly to $1.14 in 2004 and $1.59 in the TTM.
The dividend picture is not quite as nice. I would like to see a company that is paying a dividend to regularly increase that dividend. However, SYK had a $.04/share dividend in 2000, increased it to $.06/share in 2002, then since then, apparently has dropped the dividend payment to shareholders.

Similarly, I usually take a look at the number of shares outstanding each year. While I can tolerate some increase in the 'float', with a company issuing some new shares for financing purposes, a company that rapidly increases the shares outstanding is unattractive to me and I am interested in a company that can actually
decrease the number of shares, presumably by buy-backs, which tends to help with per share results. In this case, Stryker reported 391 million shares in 2000 and has increased it to 401 million in 2004 and 405 million in the trailing twelve months.
Continuing with the Morningstar.com evaluation, I take a good look at the "free cash flow". This amount represents the actual cash that a company could spend or invest in either repurchase of its own shares, dividends, or acquisitions. During the implosion of the "dot.com" bubble, many of the companies that didn't have any real earnings but had lots of cash from rich ipo's discussed their "burn rate". This was the amount of cash expended/month or year and represented the amount of time available until either the company started generating cash on its own or the company simply ran out of money.
Trying to avoid a company that is financially unhealthy, I have been examining free cash flow and am looking for companies with positive free cash flow that is
increasing.
In Stryker's case, we can see from the Morningstar report that the free cash flow has increased from $377 million in 2002 to $504 million in 2003, $406 million in 2004, and $535 million in the TTM.
What about the balance sheet? This is my next inspection deriving information from the page from Morningstar.com. All I am looking for is lots of assets and not much in the liability department! In other words, what about the current assets relative to the current and long-term liabilities?
One statistic you may read me write about is the "current ratio". This is the ratio, the comparison, between the amount of the total current assets to the total current liabilities. Generally, I have read, whenever this ratio is 1.5 or higher, the comapny is essentially 'healthy'.
In Stryker's case, the company has $532.6 million in cash and $1.832.6 million in other current assets according to Morningstar.com. When balanced against the $1.035.6 million in current liabilities, we can calculate a 'current ratio' of greater than 2:1. Stryker passes the test.
I often like to see if the current assets could pay of
all of the liabilities (current and long-term) combined. In fact when we take the combined current assets of almost $2.4 billion, compared with the combined liabilities of $1.3 billion, Stryker can almost pay off all of the liabilities two times over! Another sign of a healthy balance sheet imho.

In some fashion, I have just about completed by Momentum evaluation (picking a stock off the top % gainers for the day), my Fundamental analysis (looking at the Morningstar.com information), and now like to take a look at the stock from a value perspective.
For this, I generally turn to
Yahoo "Key Statistics" on Stryker. Some of the numbers I can glean off of this page include the size, or market capitalization of the company. The market cap is simply the product of the number of shares outstanding by the stock price. For this, I have been using the
Ameritrade definition on market capitalization: small cap stock under $500 million, from $500 million to $3 billion is a mid-cap stock, and over $3 billion is a large cap stock. Stryker is a large cap stock with a market capitalization of $19.44 billion. Generally, I have had the best luck in picking stocks which have been a bit smaller than this, more in the mid-cap stock size range.

Next on the statistics page are the earnings parameters. These two are the Price/earnings ratio, a measure of the amount of earnings power you are getting per $1 of purchase price. Higher p/e ratios show less "value" than stocks with low p/e ratios. In Stryker's case, the p/e was reported at 29.21, a tad rich compared to other stocks. More important to me is the PEG ratio which is a determination of the relative value of the p/e compared to the estimated growth rate. We obtain this off the Yahoo page, but this is calculated by dividing the p/e by the 5 yr expected growth rate. You can see that if we want to have a lot of growth without paying much of a premium for it, we want this ratio to be small as well. In general a PEG under 1.5 is reasonable and a PEG under 1.0 is downright cheap! Stryker has a PEG of 1.15 making it very reasonably valued by this measure.
The next parameter I have been examining is the Price/Sales ratio. In simple language, this is the amount of money in terms of price, that an investor has to spend to buy shares of stock, relative to the amount of sales or revenue that comes along with it. I really didn't know how to use this parameter until I read a very insightful
article from Paul Sturm in Smart Money Magazine April, 2005. Mr. Sturm pointed out how the Price/Sales ratio is most important relative to other stocks in the same type of business; what we call the "industrial group". I have been able to use the fidelity.com website to get the information about each stock and the other stocks in the same industrial group to determine relative valuation.

Looking at the
Fidelity.com eResearch website for this information, we can see that Stryker is in the "Medical Instruments/Supplies" industrial group, and is valued fairly moderately (or in the midst of the stocks) by this parameter. Leading the group in terms of richness of valuation is Alcon (ACL) with a Price/Sales ratio of 7.9, followed by Guidant (GDT) at 7.3. Stryker (SYK) is next at 3.9, followed by Boston Scientific (BSX) at 3, and Baxter (BAX) at 2.4. Thus, by this measure, Stryker is of average 'valuation'.
Finally, I like to return to the "Key Statistics" page from Yahoo to get a feeling for the amount of shares outstanding and the short interest. From this, I can see that there are 405.84 million shares outstanding but only 212.46 million of them "float" or are traded freely. Many shares must be tightly held and not available for trading.
The short interest is 4.56 million shares out short as of 2/10/06, representing 1.20% of the float or 2.3 trading days of volume. Generally, I have been using 3 days as my cut-off of significance. More than three days, imho, means that there are a lot of shares that have been sold short, and this might have a bullish effect on the stock if those short-sellers panic and start buying shares to cover their shorts. This is what we call a "short squeeze."
This page also shows that the company pays a small dividend of $.11/share yielding 0.20%. The last stock split was a 2:1 split May 17, 2004.
Finally, I take a look at a chart. I have grown comfortable with "point & figure" charts, although you may not be familiar with them. These give me a feeling for the buying and selling pressure with the columns of x's representing the stock climbing in price and the o's are price drops. Generally, I do not get much into technical analysis as I am not very sophisticated in that department. I simply want to see that the stock is generally climbing higher in price and not collapsing.
This is the
"Point & Figure" chart on Stryker from Stockcharts.com:
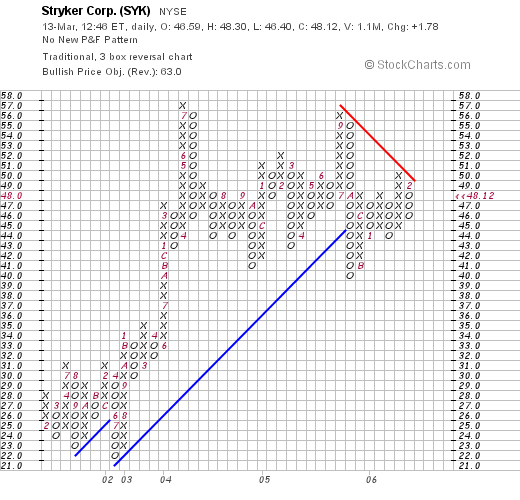
As I mentioned earlier, the stock price is unchanged from my pick over a year ago. We can see that the stock which climbed strongly between 2001 and 2004, has been 'consolidating' between the $44 and the $57 range the past 2 years or so. The stock is not moving higher, and not moving lower, and does not show as much price momentum currently as many of the other stocks discussed on this website. With the great results reported in the latest quarter, I wouldn't be surprised to see the stock break through resistance and move higher from the current level. But that is just my guess :).
So what do I think? Well in summary, the earnings were solid, the Morningstar.com report was beautiful, the PEG is under 1.5 and the Price/Sales is moderately priced as well. The chart is at best neutral.
I like the stock and especially the consistency in growth. That is why I "picked" it today! Thanks so much for visiting. I promise to not be as verbose the next time! Honest. If you have any comments or questions, please feel free to leave them on the blog or email me at bobsadviceforstocks@lycos.com.
Bob
Sunday, 12 March 2006
"Looking Back One Year" A review of stock picks from the week of December 20, 2004

Hello Friends! Thanks so much for stopping by and visiting my blog,
Stock Picks Bob's Advice. As always, please remember that I am an amateur investor so please remember to consult with your professional investment advisors prior to making any investment decisions based on information on this website.
It is time for another review of prior stock picks on this website. In order to examine the validity of my selections, I like to look back with about a trailing 60 week period to see how selections that particular week have worked out. This review assumes a 'buy and hold' strategy which for simplicity, is as good as any way of reviewing stock market strategy. However, in practice, I advise and practice the strategy of selling losing stocks quickly and completely at 8% loss limits, and selling gaining stocks slowly and partially at targeted gain levels.

On December 20, 2004, I
posted DRS Technologies (DRS) on Stock Picks Bob's Advice at a price of $44.35. (This was my second post on DRS on Stock Picks having
first posted DRS on Stock Picks Bob's Advice on 8/6/03 when it was trading at $27.98). DRS closed at $54.78 on 3/10/06, for a gain of $10.43 since posting in 2004 or a gain of 23.5%.
On February 9, 2006, DRS
announced 3rd quarter 2006 results. Earnings and revenue exceeded expectations with revenue coming in at $389.5 million, up 15% from $338.2 million the prior year. Net income was up 17% coming in at $19.7 million, up 17% from $338.2 million the prior year. On a per share basis, this was $.69/share, up from $.60/share last year. However, their guidance for the fourth quarter was a bit under the analysts' expectations.

On December 23, 2004, I
posted NAPCO Security Systems (NSSC) on Stock Picks Bob's Advice when it was trading at $13.141. Napco split 3:2 on 12/29/05 for an effective pick price of $8.76. NAPCO closed at $13.93 on 3/10/05 for a gain of $5.17 or 59% since posting.
On February 7, 2006, NAPCO
announced 2nd quarter 2006 results. For the quarter ended Decemgber 31, 2005, net sales increased 8% to $17.2 million from $16.0 million the prior year. Net income for the quarter climbed 70% to $1.5 million or $.11/diluted share, up from $872,000 or $.06/diluted share the year earlier.
By the way, unfortunately, I do not currently own any shares of either of these stock picks. I have owned DRS from time to time but do not own any shares currently.
So how did I do with these two stock picks? These two picks both have done well since they were written up and had an average gain of 41.25% during the past 60 weeks or so.
Thanks so much for stopping by and visiting my blog! If you have any comments or questions, please feel free to leave them on the blog or email me at bobsadviceforstocks@lycos.com.
Bob
Cytyc (CYTC) Weekend Trading Portfolio Analysis
Click
***HERE*** for the PODCAST ON CYTYC
Hello Friends! Thanks so much for stopping by and visiting my blog,
Stock Picks Bob's Advice. As always, please remember that I am an amateur investor, so please remember to consult with your professional investment advisors prior to making any investment decisions based on information on this website.

It is the weekend! And for me, that means it is time to review another stock in my own trading portfolio! I have been going alphabetically through my holdings, explaining my purchases and sales on a particular holding and looking closer at the underlying news and history of the stock. After
reviewing Coach (COH) last weekend, the next stock is Cytyc (CYTC) so let's take a look and see what has been happening with this particular company.

I currently own 225 shares of Cytyc (CYTC) in my trading account that were purchased 1/29/04 with a cost basis of $14.86. CYTC closed at $29.65 on 3/10/06, giving me an unrealized gain of $14.79 or 99.5% on my remaining shares of this stock.
I have sold portions of my Cytyc holdings three times already, having sold 100 shares 3/1/04 at $18.63 for a gain of $3.77 or 25.4%, another 100 shares were sold on 4/2/04 at $22.61, for a gain of $7.75 or 52.2%, and the most recent sale of 75 shares on 6/2/04 at $22.79, for a gain of $7.93 or 53.4%. Now, this holding has been sold prematurely three times! My current goals, which I have been much more disciplined with, are sales at 30%, 60%, 90%, 120%, 180%, etc. Thus ALL three sales were sold a bit quickly. However, my next sale on the upside will be at a 120% gain, or 2.2 x $14.86 = $32.69, or on the downside, at 1/2 of a supposed third sale of 90% appreciation would be at 1.45 x $14.86 = $21.55.

Let's take a closer look at this stock. First of all, what the company does! According to the
Yahoo "Profile" on Cytyc, the company
"...engages in the design, development, manufacture, and marketing of clinical products that focus on women’s health. Its products cover a range of women's health applications, including cervical cancer screening, breast cancer risk assessment, treatment of excessive menstrual bleeding, and treatment of breast cancer."
And how about the latest quarterly result?
On February 1, 2006, Cytyc
reported 4th quarter 2005 results. For the quarter ended December 31, 2005, revenue rose 25% to $138.6 million, up from $110.6 million the prior year. Net income climbed 31% to $33.4 million or $.27/diluted share, up from $25.4 million or $.21/diluted share the prior year. This was certainly a solid quarter for this company!
What about longer-term results?
Reviewing the
Morningstar.com "5-Yr Restated" financials on CYTC, we can see that revenue growth remains uninterrupted with $221 million in revenue in 2001 growing all of the way to $508 million in 2005. Earnings/share have grown strongly and steadily from $.10/share in 2001 to $.94/share in 2005. No dividends have been paid and the number of shares outstanding has been steady at 115 million in 2001 and 115 million in the trailing twelve months (TTM).
Free cash flow has been positive and growing, increasing from $64 million in 2003 to $76 million in 2004 and $135 million in 2005.
The balance sheet looks solid as well with $220.6 million in cash and $116.7 million in other current assets. When balanced agains the $89.2 million in current liabilities, this gives us a current ratio of approximately 3.5. Generally, current ratios of 1.5 or better are signs of a healthy balance sheet. In addition, the company does have $322.3 million in long-term liabilities, which hopefully will continue to be reduced as the flow of free cash continues.
And what about some valuation numbers?

Reviewing
Yahoo "Key Statistics" on Cytyc, we find that this is a large-cap stock with a market capitalization of $3.42 billion. The trailing p/e is a bit rich at 31.51, with a forward p/e (fye 31-Dec-07) a bit better at 22.63. Thus, with the rapid growth in earnings expected (5 yr expected) we have a stock with a PEG ratio of 1.38. I generally use 1.5 or lower as being a reasonably valued stock. Stocks with a PEG under 1.0 are downright cheap imho.
Using the
Fidelity.com eResearch website for valuation relative to the Price/Sales ratio, we can see that Cytyc is in the "Medical Instruments/Supplies" industrial group and is richly valued in this group relative to this ratio with a Price/Sales of 7.3. This is only exceeded by Alcon (ACL) with a ratio of 7.9 and is shares with Guidant (GDT) with a ratio of 7.3 as well. Further down the list is Stryker (SYK) at 3.9, Boston Scientific (BSX) at 3, and Baxter (BAX) at 2.4.
Looking back at Yahoo for some more numbers, CYTC has 115.3 million shares outstanding with 114.79 million shares that float. Of these, there are 3.14 million shares out short as of 2/10/06, representing 2.70% of the float or 3.4 trading days of volume (the short ratio). This doesn't appear too significant to me.
There are no cash dividends reported by Yahoo and the last stock split was a 3:1 split on 3/5/01.
What about a chart?
If we look at the
"Point & Figure" chart on Cytyc from StockCharts.com:
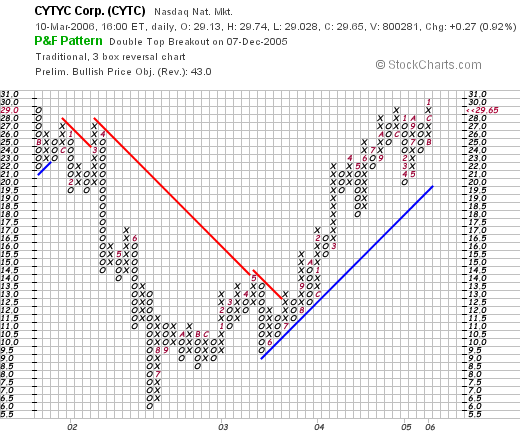
We can see that the stock was actually trading poorly from late 2001 when it was as high as $29 until July, 2002, when it dropped to as low as $6/share. The stock since that point has been trading steadily higher, breaking resistance at $12.50 in July, 2003, and climbing to the current $29.65 level. The stock chart appears strong but not over-extended imho.
So what do I think? Well the stock has been kind to me, even though I have jumped the gun several times on my partial sales. I have been exercising improved discipline the last couple of years! The latest quarterly report was strong, the Morningstar evaluation was beautiful. And the chart looks nice.
On the downside, the valuation appears to be a bit rich with a p/e in the 30's and a Price/Sales ratio near the top of its group. However, the stock is growing quickly, and the PEG isn't bad just a bit over 1.25...so there is really little to fault about this stock except that it isn't an unknown stock to the investing world.
Thanks again for stopping by and visiting. Please do feel free to drop me a line if you have any comments, questions or words of encouragement. My mail box has been a bit quiet the past week or so so here is my email address again :): bobsadviceforstocks@lycos.com. Have a great day everyone!
Bob
Posted by bobsadviceforstocks at 8:34 AM CST
|
Post Comment |
Permalink
Updated: Sunday, 12 March 2006 11:55 AM CST
Friday, 10 March 2006
March 10, 2006 Universal Security Instruments (UUU)
Hello Friends! Thanks so much for stopping by and visiting my blog,
Stock Picks Bob's Advice. As always, please remember that I am an amateur investor, so please remember to consult with your professional investment advisors prior to making any investment decisions based on information on this website.

The market is bouncing back today which is always a relief! Looking through the
list of top % gainers on the AMEX today I came across Universal Security Instruments Inc. (UUU) which as I write, is trading at $21.65/share, up $1.43 or 7.07% on the day. I do not own any shares nor do I have any options on this stock.

According to the
Yahoo "Profile" on UUU, the company
"...engages in the design and marketing of various safety products consisting primarily of smoke alarms, carbon monoxide alarms, and related products. It markets a line of residential smoke alarms that include battery, electrical, and electrical with battery backup alarms, as well as outdoor floodlights under the name ‘Lite Aide’, carbon monoxide alarms, door chimes, and ground fault circuit interrupters."
Let's take a look at the key things that I used to include this stock in the blog this afternoon:
1) Latest quarterly result.
On February 13, 2006, Universal Security
announced 3rd quarter 2006 results. For the third quarter ended December 31, 2005, sales climbed 26% to $7.4 million from $5.8 million in the same quarter the prior year. Earnings jumped 78% to $.80/diluted share, up from $.45/diluted share the prior year.
2) Longer-term results.
Reviewing the
"5-Yr Restated" financials from Morningstar.com, we see that revenue has been growing steadily from $7.7 million in 2001 to $23.5 million in 2005 and $27.5 million in the trailing twelve months (TTM).
Earnings have also improved almost perfectly (except for a dip from $1.54/share in 2003 to $1.49/share in 2004) from a loss of $(.62)/share in 2001 to $1.94/share in 2005 and $2.42/share in the TTM.
Free cash flow has been less than perfect with $-0- reported in 2003 and $-0- reported in the TTM.
The balance sheet appears solid with $1.1 million in cash and $10.5 million in other current assets balanced against $3.0 million in current liabilites. This results in a 'current ratio' of almost 4. There are no long-term liabilities reported on Morningstar.

3. Valuation.
Looking at
Yahoo "Key Statistics" on UUU, we can see that this is a TINY company with a market capitalization of only $36.65 million. The trailing p/e is nice at 8.95, and the price/sales ratio comes in at 1.24.
Referring to the
Fidelity.com eResearch website, we find that UUU is in the "Electronics Wholesale" industrial group. Within this group, Universal Security is actually the richest in valuation when measured by Price/Sales ratios. Coming in at 1.3, this tops the group which is followed by W.W. Grainger (GWW) at 1.2, Wesco International (WCC) at 0.7, Arrow Electronics (ARW) at 0.4, Avnet (AVT) at 0.3 and Bell Microproducts (BELM) at 0.1.
Going back to Yahoo, we can see there are ONLY 1.69 million shares outstanding with 1.00 million of them that float. Of these 793 shares were out short as of 2/10/06, representing 0.1% of the float or 0.2 trading days of volume. This doesn't look significant to me. No cash dividend is reported and the last stock split was a 4:3 split 4/6/04.
4. The chart.
Looking at a
"Point & Figure" chart on UUU from StockCharts.com:
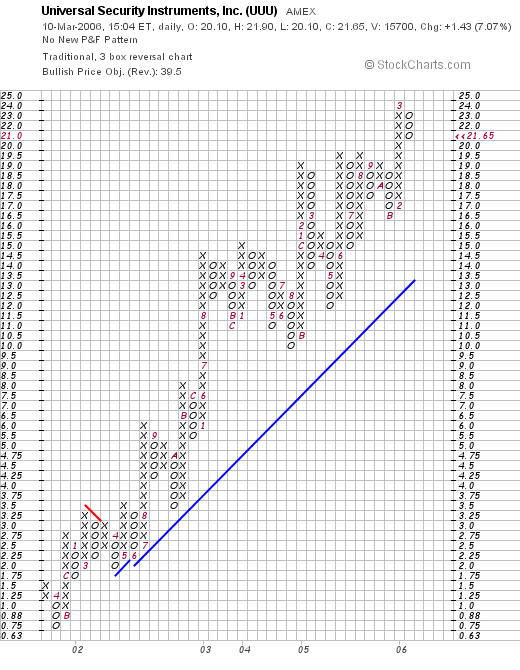
We can see what appears to me to be a phenomenal graph with the stock climbing from $.75/share in April, 2001, to the current $21 level. The chart is actually quite strong!
 So in conclusion, what do I think about this stock? Well, the very small capitalization of a stock is always intriguing to me. What I do like about the stock is the very strong quarterly report, with solid growth in both revenue and earnings, the nice Morningstar report which shows historic revenue and earnings growth, and a solid balance sheet. Valuation is nice with a p/e under 10, but the Price/Sales is actually fairly high in its group. In addition, the chart is fabulous.
On a downside, the company is not generating any free cash as far as I can tell. But the rest of the financials are superb. Unfortunately, with a micro-cap stock like this, volatility is likely to be pretty significant. And I am not in the market to be buying anything anyhow :(, as I haven't sold any stocks to give me the 'permission' to purchase a new position.
Thanks so much for stopping by and visiting! If you have any comments or questions, please feel free to leave them on the blog or email me at bobsadviceforstocks@lycos.com. Have a great weekend!
Bob
Newer | Latest | Older


