Stock Picks Bob's Advice
Wednesday, 2 November 2005
November 2, 2005 Aspect Medical (ASPM)
Hello Friends! Thanks so much for stopping by and visiting my blog,
Stock Picks Bob's Advice. As always, please remember that I am an amateur investor, so please remember to consult with your professional investment advisors prior to making any investment decisions based on information on this website.

Sometime around noon, I was scanning the
list of top % gainers on the NASDAQ today, and found Aspect Medical (ASPM) on this list. The stock looks like a good fit to what we do here. Unfortunately, with all of the other stocks doing well late in the day, the stock was no longer on the list of top gainers! However, it is still worth a look. I do not own any shares nor do I have any options on this stock.

Aspect had a great day today, closing at $35.40, up $2.92 or 8.99% on the day. According to the
Yahoo "Profile" on Aspect Medical, the company "...and its subsidiaries engage in the development, manufacture and marketing of an anesthesia monitoring system called the BIS system. The company's BIS system provides information that enables clinicians to assess and manage a patient's level of consciousness in the operating room and intensive care settings, and administer the amount of anesthesia needed by each patient."
I recently wrote up a similar company,
Somanetics, on Stock Picks Bob's Advice, that is also in the anesthesia monitoring business. This must be an important growth area in the medical field.
Trying to avoid sounding like a broken record, what drove the stock higher today was the
announcement of 3rd quarter 2005 results. Revenue came in at $19.6 million for the quarter ended October 1, 2005, an increase of 44% (!) over the $13.6 million reported in the third quarter of 2004. Net income came in at $2.6 million or $.11/share on 24.2 million diluted shares, up about 400% from $520,000 or $.02/share on 22.4 million diluted shares last year. This was $.04 ahead of analysts estimates of $.07/share and ahead of revenue estimates of $19.3 million for the quarter. In addition, the company guided estimates for earnings higher for the upcoming fourth quarter. The combined strong earnings/revenue results that also exceeded estimates along with the raised guidance was enough to push the stock price higher!

How about 'longer-term'? Looking at the
Morningstar.com "5-Yr Restated" financials on ASPM, we can see that except for a small dip in revenue from $36 million in 2000 to $35.8 million in 2001, the company has grown revenue steadily to $65.2 million in the trailing twelve months (TTM).
Aspect has been improving its earnings picture, from a loss of $(1.01) in 2001, the company turned profitable at $.01/share in 2004, with $.19/share in the TTM.
Free cash flow, which was also negative at $(6) million in 2002, improved to a negative $(2) million in 2004 but a positive $5 million in the trailing twelve months.
The balance sheet, as reported on Morningstar, looks excelent with $40.2 million in cash alone, enough to cover both the $13.9 million in current liabilities
and the $4.7 million in long-term liabilities over two times over. In addition, the company has an additional $15 million in "other" current assets.
Looking at
Yahoo "Key Statistics" on Aspect Medical for some valuation numbers, we can see that this is a mid cap stock with a market capitalization of $765.24 million. The trailing p/e is an astronomic 202.29, with a forward p/e of 66.79 (fye 31-Dec-06). This is not of much concern to me as the company is growing earnings rapidly and just turned profitable.
The company also looks richly priced in terms of Price/Sales with a statistic of 11.9 at the top of the group of "Medical Appliances/Equipment" according to
Fidelity.com eresearch on ASPM. Following Aspect is St. Jude (STJ) with a Price/Sales of 7.1, Medtronic (MDT) at 6.6, Zimmer Holdings (ZMH) at 5, Biomet (BMET) at 4.6, and Edwards Lifesciences (EW) at 2.7. Thus, the stock isn't a "bargain" based on this particular parameter also.
Going back to Yahoo, we can see that they are reporting 21.62 million shares outstanding with 1.45 million shares out short as of 10/11/05. This is 7.00% of the float or 8.7 trading days of volume. The "shorts" might have been "squeezed" today as the stock moved higher on great news. No cash dividend is reported on Yahoo, and no stock dividends are noted as well.
What about a chart? Taking a look at the
Stockcharts.com "Point & Figure" chart on ASPM:
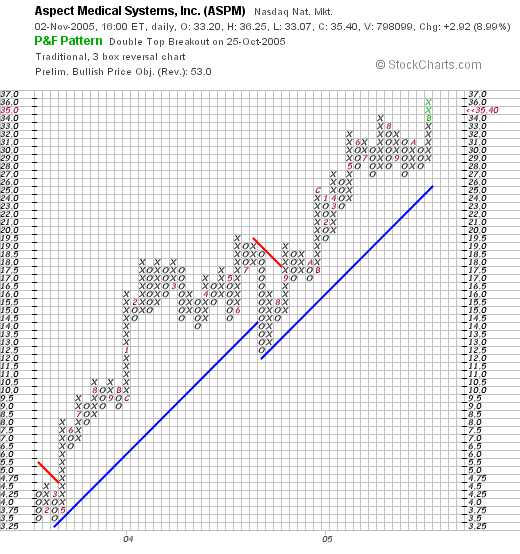
We can see what is an absolutely gorgeous graph! In May, 2003, the stock broke through a resistance level at $4.75 and has been trading strongly higher ever since! You won't see too many stronger graphs, imho, on this blog!
So what do I think? Frankly, I like this stock. It is a small company with a phenomenal quarter a provocative product, a nice Morningstar.com report with steady revenue and improving earnings. The company is just turning profitable as well as turning free cash flow positive. In addition the company has a solid balance sheet. On the downside, with the recent turn to profitability the company has an astronomic p/e but this should be dropping quickly. The Price/Sales ratio is also steep. Finally, the graph is spectacular :).
Too bad I don't have a signal to be buying some stock :(. I know where I would be shopping today!
Thanks so much for stopping by! If you have any questions or comments, and if you don't mind me writing up a response on the blog, please drop me a line at bobsadviceforstocks@lycos.com. Or you could always leave your comments right on the blog itself! Regards to all of my friends!
Bob
Monday, 31 October 2005
"Revisiting a Stock Pick" Hi-Tech Pharmacal (HITK)
Hello Friends! Thanks so much for stopping by and visiting my blog,
Stock Picks Bob's Advice. As always, please rememember that I am an amateur investor, so please remember to consult with your professional investment advisors prior to making any investment decisions based on information on this website.

I looked through the
list of top % gainers on the NASDAQ today, and came across Hi-Tech Pharmacal (HITK) which closed at $37.55, up $3.78 or 11.19% on the day. I do not own any shares nor do I have any options on this company.

I first
posted HITK on Stock Picks Bob's Advice on September 8, 2003, when the stock was trading at $28.75. Thus, we have a gain of $8.80 or 30.6% since posting this stock here a little over two years ago!
According to the
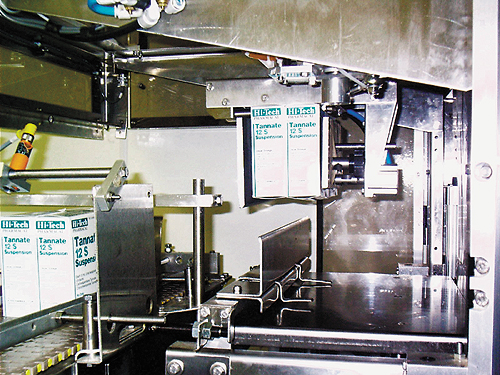
Yahoo "Profile" on Hi-Tech Pharmacal, the company "...engages in the manufacture and marketing of prescription, over-the-counter, and nutritional products in liquid and semi-solid dosage forms in the United States. It manufactures generic and branded products, most of which are prescription items and include oral solutions and suspensions, as well as topical creams and ointments."

On September 8, 2005, HITK
1st quarter 2006 earnings results. For the quarter ended July 31, 2005, net sales came in at $15.4 million, a 27% increase over the $12.1 million for the same quarter ended July 31, 2004. Net income for the quarter was $1.4 million, a 62% increase over the $869,000 reported in the same quarter in 2004. Fully diluted earnings per share climbed 60% to $.16/share from $.10/share in the same quarter last year. These were great results for this relatively small company!
Looking longer-term at the
"5-Yr Restated" financials from Morningstar.com on HITK, we can see the beautiful series of purple bars representing the steady growth in revenue from $29.6 million in 2001 to $71 million in the trailing twelve months (TTM).
Earnings have also steadily grown (except for a flat year between 2003 and 2004), from $.36/share to $1.02/share in the TTM. Free cash flow has been positive and growing from $4 million in 2003 to $8 million in the TTM.
The balance sheet, as presented on Morningstar.com, is absolutely 'gorgeous', with $39.1 million in cash, enough to pay the combined $11.8 million in current liabilities and the $1.2 million in long ter liabilities, more than 3 times over! In addition, the company has another $23.9 million in other current assets.
What about some "valuation statistics"? Looking at
Yahoo "Key Statistics" on HITK, we can see that this is a very small company, with a market capitalization of only $295.71 million. The trailing p/e is a bit rich at 36.67, with a forward p/e of 30.67 (fye 30-Apr-07). No PEG is reported by Yahoo.
Reviewing the data from the
Fidelity.com eresearch website, we can see that HITK has been assigned the "Drugs-Generic" industrial group. Within this group of stocks, HITK is moderately priced with a Price/Sales ratio of 4.2. Ahead of HITK is Bar Pharmaceuticals (BRL) with a ratio of 5.8, Mylan (MYL) at 4.5; stocks with ratios lower than HITK, included Ivax (IVX) at 3.8, Watson Pharmaceuticals (WPI) at 2.5, and Par Pharmaceutical (PRX) at 1.8.
Reviewing some additional figures from Yahoo, we can see how small this company really is, with an outstanding 7.88 million shares! Currently there are 323,940 shares out short (10/11/05), representing 5.50% of the float or 3 trading days of volume (the short ratio). This is at my own personal limit of significance for short sales, and thus doesn't look too elevated to me.
The company does not pay a dividend and the last stock split was a 3:2 split 1/21/03.
What about a chart? Reviewing the
"Point & Figure" chart from Stockcharts.com:
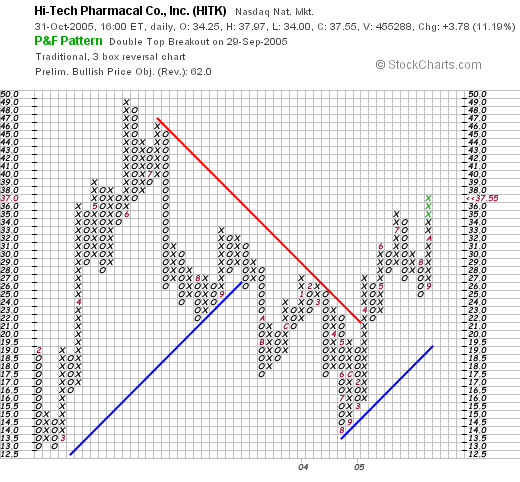
 We can see that the stock was trading higher from February, 2003, through July, 2003, when the price broke down and the stock declined steadily to a low of $14.00 in August, 2004. The stock then moved higher, breaking resistance at $21 in March, 2005, and has been trading higher since. The stock looks strong and not over-valued. At least in the short-term, the stock looks strong.
So what do I think? The last quarter was exceptionally strong, the Morningstar report was excellent with steady five year revenue and earnings growth. The company is spinning off free cash flow that is growing and the balance sheet is fabulous. Valuation-wise, the P/E seems a bit rich, but then again with the huge growth reported in the very latest quarter, this doesn't see very out of line to me. The company is so small, that the required estimates for Yahoo to provide a PEG apparently are not available.
The Price/Sales ratio is relatively reasonable with the generic drug group. Finally, the chart looks strong but certainly not way over-extended. The stock just recently broke through resistance and is now moving higher.
 An added plus is the very small size of this company which barely qualifies as a small cap stock instead of a micro cap stock. The potential really does seem to be "sky's the limit" for this stock!
Thanks so much for stopping by and visiting! If you have any questions or comments, please feel free to email me at bobsadviceforstocks@lycos.com or leave your words right here on the blog! I hope everyone had a Happy Halloween and avoids eating too much of that candy your kids are bringing in!
Bob
Sunday, 30 October 2005
"Looking Back One Year" A review of stock picks from the week of August 23, 2004

Hello Friends! Thanks so much for stopping by and visiting my blog,
Stock Picks Bob's Advice. As always, please remember that I am an amateur investor, so please remember to consult with your professional investment advisors prior to making any investment decisions based on information on this website.

It is almost Halloween, and I was out at a party this afternoon doing of all things a scavenger hunt. My team came in last. But we had a good time in any case. But this evening, I wanted to make sure I take care of my "review" that I like to do each week, looking back about a year at all of the picks that week, and seeing how they turned out!
 Fortunately, I only picked one stock during the week of August 23, 2004. On August 25, 2004, I picked Williams-Sonoma (WSM) for Stock Picks Bob's Advice when it was trading at $34.64. WSM closed at $37.34 on 10/28/05, for a gain of $2.70 since posting or 7.8%.
 On August 23, 2005, Williams-Sonoma reported 2nd quarter 2005 earnings results. Revenue grew 13% to $776.2 million from $689.6 million for the same quarter last year. Net income grew to $30.8 million or $.26/share, for the three months ended July 31, 2005, up from $27.6 million or $.23/share last year. As reported elsewhere, comparable store sales increased 3.7% during the quarter.
Thus, with only one stock to review for the week, the performance for that stock, Williams-Sonoma (WSM), was a gain of 7.8% since listing on the blog.
Thanks again for stopping by and visiting! If you have any questions or comments, please feel free to leave them right on the blog or email me at bobsadviceforstocks@lycos.com. Have a great week trading and investing in the market!
Bob
"Weekend Trading Portfolio Analysis" Genesco (GCO)
Hello Friends! Thanks so much for stopping by and visiting my blog,
Stock Picks Bob's Advice. As always, please remember that I am an amateur investor, so please remember to consult with your professional investment advisors prior to making any investment decisions based on information on this website.

For those of you who are new to this blog, I enjoy "picking" stocks and discussing possible investments that look attractive to me. Something else I do, is to share with you my actual trading portfolio and give you my view on the stocks I hold in my own actual portfolio. When I buy a stock, I post this on the blog, when I sell a stock, I post it on the blog. Usually under the subtitle "Trading Transparency". And lately, I have been trying to go through my holdings, one issue each week, and review again my history with the stock and whether the stock still looks attractive to me.
Last weekend I
discussed Cytyc (CYTC) on Stock Picks Bob's Advice. Going alphabetically through my list of 19 stocks I currently hold, the next to be reviewed is Genesco (GCO).

I first
discussed Genesco (GCO) on Stock Picks Bob's Advice on November 18, 2004, when the stock was trading at $28.35. On May 26, 2005, I made my initial purchase of GCO in my trading account, purchasing 200 shares at a cost basis of $34.40. GCO closed at $35.85 on 10/28/05, for a gain of $1.45 or 4.22% since purchasing these shares. I plan on either selling all my shares when the stock hits an 8% loss or .92 x $34.40 = $31.65, or sell 1/4 of my position if the stock should appreciate to a 30% gain or 1.30 x $34.40 = $44.72.

According to the
Yahoo "Profile" on Genesco, the company "...engages in the design, marketing, and distribution of footwear, headwear, and accessories. The company distributes footwear under its own Johnston & Murphy brand and under the licensed Dockers brand to retail accounts, including various department, discount, and specialty stores. It operates through five segments: Journeys, Underground Station Group, Hat World, Johnston & Murphy, and Dockers Footwear."
On August 24, 2005, Genesco
reported 2nd quarter 2005 results and also raised guidance for 2006. For the three months ended July 30, 2005, net sales increased 12% to $275.2 million from $245.9 million the prior year. Net earnings grew 41% to $6.7 million from $4.8 million the prior year. On a diluted share basis, this came in as a 35% increase to $.27/share, up from $.20/share the prior year same period.
Checking the
Morningstar.com "5-Yr Restated" financials, we can see the steady increase in revenue from $.7 billion to $1.2 billion in the trailing twelve months (TTM).
Earnings during this period have grown fairly steadily, except for a drop in 2004, from $1.21 in 2001 to $2.07 in the TTM.
Free cash flow has increased from $6 million in 2003 to $67 million in the TTM.
In addition, the balance sheet looks good with $38.8 million in cash and $312.2 million in other current assets, plenty to cover the $168.8 million in current liabilities, with enough 'left over' to pay off most of the $229.1 million in long-term liabilities.
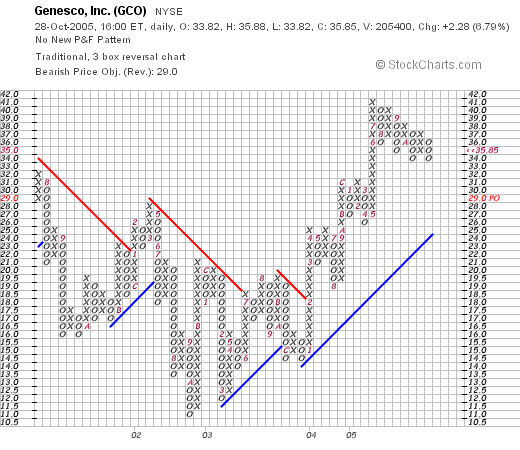
What about the chart? Taking a look at the
"Point & Figure" chart from Stockcharts.com on GCO, we can see how the stock had been trading at flat to lower between July, 2001, when the stock was trading as high as $32 to a low of $11 in July, 2002. The stock broke through resistance at around $18.50 in February, 2004, and hasn't looked back since, closing as noted on $35.85 on Friday.
So what do I think? I like the stock. In fact, I own the stock! However, I was and am prepared to sell all of the shares if the stock hits an 8% loss, no matter how much I think the stock is a good investment. The latest earnings were solid. Revenue and earnings have been great long-term, and solid the past few years. And the balance sheet looks reasonable, especially with the growing free cash flow.
Thanks so much for stopping by! If you have any questions or comments, please feel free to leave them on the blog or email me at bobsadviceforstocks@lycos.com.
Bob
Saturday, 29 October 2005
A Reader Writes "...I wondered if you have an ideas as to why."
Hello Friends! Thanks so much for stopping by and visiting my blog,
Stock Picks Bob's Advice. As always, please remember that I am an amateur investor, so please remember to consult with your professional investment advisors prior to making any decisions based on information on this website.
I was delighted to see that I had received another email today. This time from Linda B. who wrote:
Just wanted to say that I've been visiting your website for about six months in order to learn all I can before investing a small inheritance (< $20K). I have learned investing basics in an investment club but recently got out of it -- and want to do my own careful investing. I'm so afraid of losing my windfall, and am pretty much still a novice at investing, so I really do appreciate your analyses and explanations. So far, I haven't gotten my feet wet, but have to grit my teeth sooner or later and take the plunge.
I've been looking at KSWS and appreciated your recent comments on it. But then it dropped precipitously after earning were reported -- and I wondered if you have an ideas as to why.
Thanks again -- I start each morning by visiting your website with a cup of coffee and an eagerness to learn what you have to share that day.
Sincerely,
A neighbor in Minnesota,
Linda B.
Linda, thank you for your kind words. I hope that my writing gets you going in the morning and doesn't instead give you any indigestion :).
I believe that you are wise to be afraid of losing your windfall of $20k inheritance. It is wise to be cautious, to have a plan, and yet be willing to take limited risk to allow that windfall to appreciate.
You ask about KSWS that I recently wrote-up. Let's start out with an updated
"Point & Figure" chart on KSWS from Stockcharts.com:
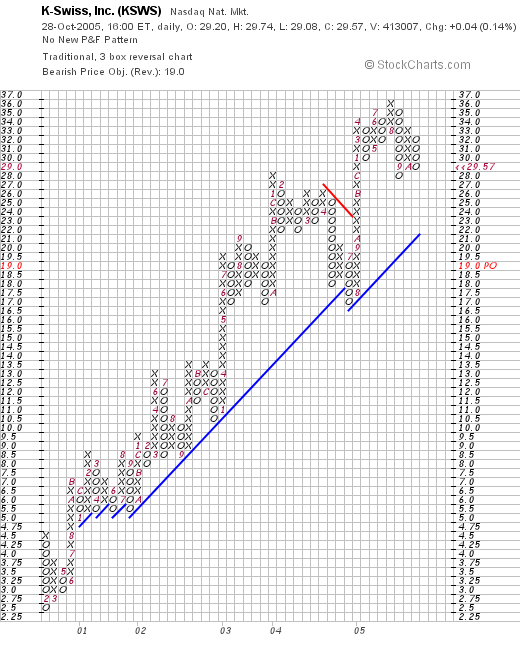
Here we can see that while the stock pulled back a bit, the stock was actually up $.04 yesterday to $29.57. Overall, the stock price picture does not appear to have truly broken down. It helps to get the big picture right. By the way, I do not own any shares or options on this stock.
Looking through the Yahoo "Headlines" on KSWS, I really couldn't see any news to tell me why the stock might be pulling back on the short-term. I really believe that the biggest effect on stocks is the "M" of CANSLIM that William O'Neil likes to talk about....he is the publisher of the Investor's Business Daily and he is quite brilliant, although a bit more politically conservative than I am :).
The "M" is the MARKET. That is, the trading environment has been awful recently. That is why my portfolio has shrunk from 25 to my current 19 position level. Not because I was "thinking" and decided to move into cash, but because the stocks I own are hitting sale points. And none are signalling me to do any buying.
Thus, even with a great stock, you are bound to lose money if you try to fight the overall market.
What to do? Well, if you were investing your $20k, let's assume that you wanted to invest in 12 stocks with about a $1600 investment per stock. In that case, I would start at "neutral", that is invest half of your cash in 6 stocks leaving the rest in cash. Only add a position above 6 if you get a sale at a gain. And allow your 6 to go down to 3 positions if things are sold at losses.
Just an idea. But you are right to be cautious. I am just not good at timing the market, knowing when to move in or out. I just want to let my portfolio make the decisions for me!
Thanks again for writing. I am a big fan of Minnesota living just across the river, but I confess I was rooting for the Packers even if I didn't watch the game :). Maybe next year?
Regards from Wisconsin.
Bob
A Reader Writes "I was wondering about your entry method...."
Hello Friends! Thanks so much for stopping by and visiting my blog,
Stock Picks Bob's Advice. As always, please remember that I am an amateur investor, so please remember to consult with your professional investment advisors prior to making any investment decisions based on information on this website.

I always enjoy getting email from my readers. It makes everything I do worthwhile knowing that there are people out there who enjoy reading what I am writing! (Remember that first paragraph :), I am truly an amateur investor, so considers these answers as part of a discussion rather than individual advice!)
Anyhow, Eric L. writes:
Bob,
I was wondering about your entry method when taking a position in a stock. From you blog, is it correct to say when taking a new position that you buy the day that the stock reports earnings if the earnings report is favorable? Do you buy at the close or just as soon as you can?
There's a stock that I'm interested in, ESRX, which reported earnings on 10/27, and then it closed up 17%. I was hoping for a pull back today, but it closed up another 2.5%. How do you take a position in a stock like that?
Also, what do you do with a stock that has a great earnings report but sells off sharply? I like CRDN, which also reported earnings on 10/27 and I thought the earnings report was pretty good. Notwithstanding, the stock closed down 15% that day. The next day it recovered partially and closed up 6%. Would you take a position in a stock like that?
Would really appreciate a reply if you can spare a few minutes to answer. By the way, I very much enjoy your blog. I wish I was as capable as you at investing.
Regards,
Eric
First of all thanks for writing and especially thanks for the kind words! I do not think that I do anything magical that anyone else couldn't figure out....so hang in there.
Let me try to answer your questions in order. First of all, I often do purchase stocks when they are announcing great earnings. But that is not the criterion that I use to make a decision on purchasing a stock.
There are two things that I use to make a purchase. First of all, assuming I am under 25 positions, my personal maximum number of holdings, I only am in the "purchase mode" if I have "permission" from my portfolio :). Now you might think that is a peculiar way to approach things. But I use my own portfolio as an indicator on the health of the overall market. That is, I require a sale on "good news" to "entitle" me to purchase a stock. A "good news" sale is a sale of a portion of a holding, that is usually a 1/4 position, of one of the stocks I already own.
Assuming I have made a sale, I often will purchase a stock, in fact usually, that very day. If you read through my blog, you will hear me writing about nickels "burning a hole in my pocket". That is my attempt at humor, explaining that when I have "permission" to make a purchase, I usually have loads of stocks that are candidates for purchase.
What makes a stock "eligible", assuming that I am "entitled" to purchase a new position? As I have reviewed on many different entries, I am looking first of all on the list of top percentage gainers. This is my first screen and I generally purchase a stock the same day it is on that list. This is my way of finding a stock which has the best momentum that particular day when I am purchasing a stock.
It is a bit of an arbitrary rule, but it seems to be working for me! Now about earnings, I have found that many of the stocks that I like are making the top % gainers list on the same day that good earnings reports are issued. That makes a stock attractive to me as well. But the earnings portion of the indicator isn't necessary, just that it made the list.
After that, I check Morningstar for steady revenue/earnings/free cash flow/ and balance sheet. In addition, I require that the latest quarter shows increasing profitability as well as revenue growth over the prior year's results.
You asked about ESRX, and without reviewing that particular stock, you comment on how you observed the stock moving up 17%, you waiting for a pull back, and then the stock moving higher another 2.5%. And you ask me how I would take a position in a stock like that.
I do not believe I can predict future stock movement. I am just not that good ;). However, I wouldn't be looking at ESRX with my peculiar approach, unless the stock made the top % gainers list
and I was entitled to make a purchase. Lots of coincidences I guess :). Thus, if I had sold some stock on the day that ESRX was making a big move higher, I would go ahead and purchase some shares that day. If I had my "indicator" the following day, and ESRX wasn't on the list, well I would just pass on that stock.
Will I miss lots of investment this way? Most definitely. But on the other hand, if my approach works, well, that's enough for me!
You probably are shaking your head figuring I am nuts or something :). However, what I am trying so hard to do is to remove my emotions from my trading activity. I want to be a good observer of the market. To listen to my own portfolio. To buy when the buying is good, and to pull in my horns, so to speak, when things are negative. I try to respond to the market, to listen to what the market is telling me, and not to "think" or speculate too much.
You mentioned Ceradyne (CRDN), a stock that I have owned in the past, and that my stock club has also owned. You ask about the stock moving lower 15%. And the next day it going higher 6%. Would I take a position in a stock like that. O.K., back to my same old answer. If I had sold a stock that day on a gain, was below my maximum number of positions, and the stock that day was on the top % gainers list, and it passed the rest of my screens, well yes I would. Hmmm...I hope that answers your question.
In summary, I have removed my own intuition about stocks, except when I have the opportunity of selecting from among several stocks that are available for me to purchase among the top % gainers...then I try to make a guess :). Otherwise, I don't chase stocks, I don't outthink the market, I don't speculate that the stocks are great values, I simply buy stocks that are moving higher and have the characteristics that I feel will help them continue to appreciate in price!
Thanks again for visiting. Please let me know if my explanation is at all helpful to you! My approach is not the only, nor do I claim it is the best approach to buying stock. In fact, it is a bit peculiar even from my view. But it seems to be working and I shall continue to share with all of you my continued experience in its application.
Bob
Friday, 28 October 2005
October 28, 2005 MICROS Systems (MCRS)
Hello Friends! Thanks so much for stopping by and visiting my blog,
Stock Picks Bob's Advice. As always please remember that I am an amateur investor, so please remember to consult with your professional investment advisors prior to making any investment decisions based on information on this website.

With the market moving higher today, several stocks showed up on the momentum lists (
top % gainers on the NASDAQ) that appear to fit my criteria for inclusion here.
As I write, MICROS (MCRS) is trading at $45.82, up $3.71 or 8.81% on the day. According to the
Yahoo "Profile" on MICROS, the company "...engages in designing, manufacturing, marketing, and servicing enterprise information solutions for the hospitality and specialty retail industries worldswide." I do not own any shares nor do I have any options on this company.
Trying to avoid sounding like a 'broken record', what drove the stock higher today, was the announcementof
1st quarter 2006 results. Sales for the quarter ended September 30, 2005, grew 17% to $152 million and net income of $12.4 million or $.30/share up from $9.7 million or $.25/share last year.
Looking at the
Morningstar.com "5-Yr Restated" financials, we can see that revenue for this company has been steadily growing from $332.2 million in 2001 to $597.3 million in the trailing twelve months (TTM).
In addition, earnings have also steadily grown, increasing from a loss of $(.02)/share in 2001 to $1.35 in the TTM. Recently, free cash flow has improved from $35 million in 2003 to $80 million in the TTM.
The balance sheet looks solid with $153.5 million in cash and $213.9 million in other current assets. This is plenty to cover both the $177.0 million in current liabilities and the $25.1 million in long-term liabilities, almost two times over.
Looking at some
"Key Statistics" on MCRS from Yahoo, we find that this is a mid-cap stock with a market capitalization of $1.76 billion. The trailing p/e is a moderate 34.02, and the forward p/e (fye 30-Jun-07) is more reasonable at 23.76. The PEG is still a bit rich at 1.37.
Using the
Fidelity.com eresearch website for a look at valuation in regards to the Price/Sales figures, we find that MCRS is quite reasonably priced within the "Technical System/Software" Industrial Group. Heading this list is INFOSYS (INFY) at 9.7 Price/Sales, Autodesk (ADSK) at 8.0, Mercury Interactive (MERQE) at 4.4, MANHATTAN ASSOC (MANH) at 3.0, and MICROS (MCRS) at 2.8. Take-Two Interactive Software finished the list with a Price/Sales ratio of 1.0.
Looking back at Yahoo for some additional statistics, we find that there are 38.44 million shares outstanding and of these, 2.04 million or 5.305 of the float, are out short. This appears significant to me with 7.3 trading days of volume involved.
No cash dividend is reported and the last stock split was a 2:1 split 2/2/05.
What about a chart? Taking a look at a
"Point & Figure" chart on MCRS from Stockcharts.com:
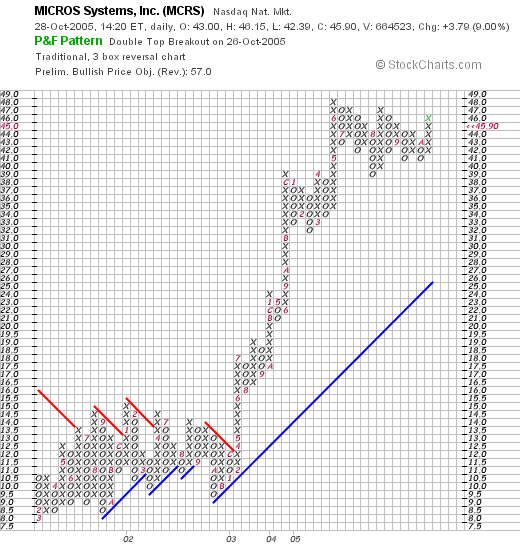
We can see that the chart shows the stock moving sideways between 2001 and late 2002, between the rant fo $7.50 and $14.00. The stock broke through resistance at around $12 in March, 2003, and has moved sharply higher since then. The chart overall looks quite strong, if not a bit ahead of itself.
So what do I think? Well, the latest quarter was solid, the Morningstar.com report looks encouraging, with steady revenue and earnings growth alongside free cash flow and a nice balance sheet. Valuation is o.k. with a bit of a rich p/e and PEG, but the Price/Sales is reasonable within the assigned group on Fidelity. All-in-all an attractive investment imho. Now, if only I could be buying stock :(.
Thanks so much for stopping by! If you have any questions, or comments, please feel free to leave them on the blog or email me at bobsadviceforstocks@lycos.com.
Bob
"Trading Transparency" American Medical Systems Holdings (AMMD)
Hello Friends! Thanks so much for stopping by and visiting my blog,
Stock Picks Bob's Advice. As always, please remember that I am an amateur investor, so please remember to consult with your professional investment advisors prior to making any investment decisions based on information on this website.
Earlier this morning, my shares of American Medical Systems Holdings (AMMD) hit a sale target on the downside. I sold my 230 shares of AMMD at $16.07. The stock sold off on earnings news that at first glance don't seem too bad at all, but apparently somebody must have seen something they didn't like, and drove the stock lower. As I write, AMMD is trading at $16.05, down $(1.73) or (9.73)% on the day.
AMMD split 2:1 on March 22, 2005. I made an initial purchase of 200 shares (pre-split) on 1/9/04 with a cost basis of $25.82/share. On 6/24/04, I sold my first portion of this investment, 50 shares (representing 1/4 of my position) at $32.08 for a gain of $6.26 or 24.2% (a bit earlier than my current 30% gain target). My second sale was for 35 shares of my remaining 150 share position (approximately 1/4 of my holding) at $40.92, for a gain of $15.10 or 58.5% on 12/21/04. Thus with two sales, approximately at 30% and 60%, my strategy is to unload my remaining shares if the stock price retraces to 50% of the highest % appreciation target. In this case, if the stock retraced to a 30% gain level.
Earlier today, with the stock selling at $16.07, with a split-adjusted cost basis of $12.91, I had a gain of $3.16 or 24.5%, thus passing the 30% level I had targeted to unload my remaining shares. I entered the order ASAP and sold all of my remaining holdings in the stock.
Let's take a quick look at the
"Point & Figure Chart" on AMMD and see if we can see the break-down in support for the stock:
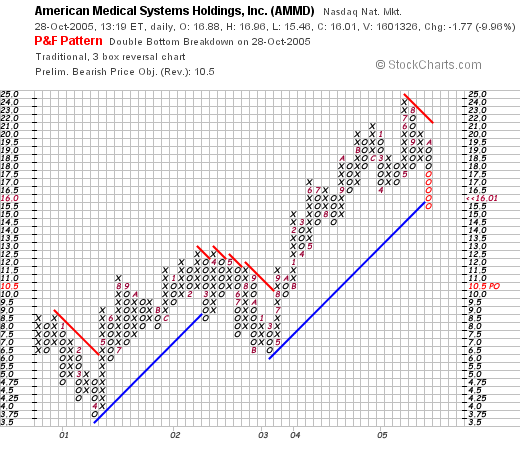
Here we can see how the stock has been moving ahead steadily, and yes, the stock just broke through its support line, suggesting a possible weakening of the price action on this stock.
Thanks again for stopping by! As you know, when I sell a stock in my trading portfolio on "bad news", I need to "sit on my hands" and not go ahead and reinvest the proceeds.
If you have any questions or comments, please feel free to leave them on the blog or email me at bobsadviceforstocks@lycos.com.
Bob
Thursday, 27 October 2005
"Revisiting a Stock Pick" ASV (ASVI)
Hello Friends! Thanks so much for stopping by and visiting my blog,
Stock Picks Bob's Advice. As always, please remember that I am an amateur investor, so please consult with your professional investment advisors prior to making any investment decisions based on information on this website.

The market is weak this morning. However, that doesn't mean we cannot find stocks that might eventually be worth investing money in! But it does mean, that we should exercise caution adding money to our portfolio in the midst of corrections. Better to buy on the way up imho.
Looking through the
list of top % gainers on the NASDAQ today, I came across A.S.V., Inc. (ASVI), which as I write is trading at $23.02, up $3.10 or 15.56% on the day. I have owned shares of ASV in a managed account (that I am not consulted about) but I believe those shares have been sold and I am not currently a shareholder. (You can see how closely I follow
that account!).
According to the
Yahoo "Profile" on ASVI, the company "...engages in the design, manufacture, and sale of track-driven all-season vehicles."

I first
posted ASVI on Stock Picks Bob's Advice just about a year ago, on November 10, 2004, when the stock was trading at $44.07. The stock split 2:1 on 8/25/05, resulting in our "pick price" actually being $22.04. Thus, the stock is only currently trading $.98 ahead of our pick price last year or ahead by 4.4%. This pick certainly has not gotten away from us!
Earnings are one of the major determinants of stock prices both short-term and long-term imho. And it is not surprising to me that what drove the stock higher was the release of
3rd quarter 2005 results this morning just before the opening of trading.
For the quarter ended September 30, 2005, sales increased 70% (!) to $69.2 million from $40.6 million in the same period last year. Net earnings were also up sharply with $8.0 million reported vs. $4.4 million reported in the same period the prior year. On a diluted per share basis, earnings came in at $.29/share, a 71% increase from $.17/share last year same period. In addition, to top it off, for the so called icing on the cake, the company
raised guidance on both sales and earnings for the full year.

How about longer-term? Looking at the
Morningstar.com "5-Yr Restated" financials, we can see a steady rate of sales between 2000 when $43.9 million was reported and 2002 when $44.2 million was noted. However, since then there has been a steady and strong growth in revenue to $198.6 million reported in the trailing twelve months (TTM).
Earnings have followed a similar pattern with $.08/share reported in 2000 dropping to $.07/share in 2002. Again, since 2002, there has been a sharp rise in earnings to $.78 reported/share in the TTM.
Free cash flow isn't quite as nice, with $0 reported in 2002, dropping to $(8) million in the TTM. With everything else in line, I have chosen to overlook this free cash flow number. As you probably know, all things being the same, I much prefer to see strong and steady growth in free cash flow in the stocks I "pick".

The balance sheet, as reported by Morningstar, looks fabulous allowing me to justify overlooking the latest twelve month
negative free cash flow. The company is reported to have $25.6 million in cash, enough to cover both the $20.6 million in current liabilities
and the $2.5 million in long-term liabilities combined. In addition, the company is reported to have a substantial $91.6 million in other current assets.
Looking at
Yahoo "Key Statistics" on ASVI, we can see that this is a small cap stock with a market capitalization of only $615.23 million. The trailing p/e isn't too bad at 29.52, with a forward (fye 31-Dec-06) p/e of 20.64. With the nice growth, and I don't believe this statistic has been adjusted for today's numbers, the PEG is still a reasonable 1.14. I suspect the PEG is likely to be under 1.0 in light of the superb report today.
Using
Fidelity.com eresearch website, to try to get a handle on valuation in terms of the price/sales figure (I like to compare, a la Paul Sturm, the price/sales numbers to other companies in the same industrial grouping), we find that ASVI is tops in the group "Farm/Construction Machinery" with a price/sales ratio of 2.8. Following ASV is Joy Global (JOYG) at 2.1, Caterpillar (CAT) at 1.1, Deere (DE) at 0.7, AGCO (AG) at 0.3 and CNH Global (CNH) at 0.3. Certainly from this particular perspective, ASVI is not a screaming bargain!
Returning to Yahoo for some additional parameters, we note that there are only 26.85 million shares outstanding. Currently, 2.96 million are out short, which is 16.50% of the float! This amounts to 10.1 trading days of volume. Using my own 3 day rule, this appears quite significant, and we may be seeing a bit of a short squeeze as all of these short-sellers may be rushing to cover on this relatively lightly traded stock!
No cash dividend is paid, and as I noted earlier, the company did split its stock on August 25, 2005.
What about a chart? Looking at a
"Point & Figure" chart on ASVI from Stockcharts.com:
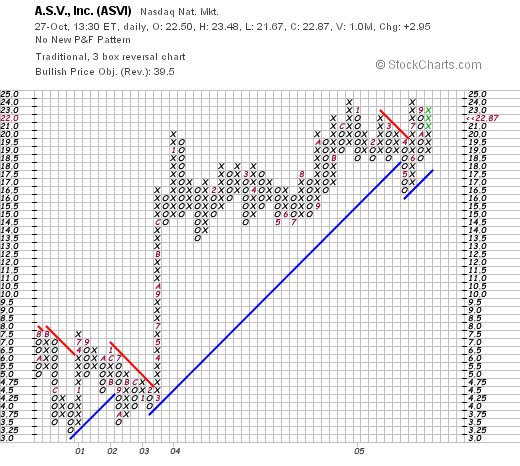
We can see that the stock traded sideways between 2000 and early 2003 when, as we have noted, the company also performed in a relatively 'flat' fashion. In early 2003, the stock climbed from $4.00/share in March, 2003, to $20/share in January, 2004. Since then, the stock has traded basically sideways, has developed new support levels at this price point, and appears to be poised for another upward move assuming it can get through about $24 on the upside imho. The chart looks fine to me!
So what do I think? Well, the latest quarterly report was absolutely superb. The revenue was great, the earnings were strong, and guidance was revised higher! In addition, except for a period between 2000 and 2002, the company has been growing its revenue and earnings steadily and in a strong fashion. In addition, the balance sheet looks great.
On a negative, the free cash flow is negative, the price/sales is a bit rich, although the p/e isn't bad and I suspect that the PEG would also be close to or under 1.0 if estimates took into consideration the current quarter. The chart looks fine to me as well.
Thus, if I were in the market to buy some shares, this stock, especially with that latest quarterly report, might well be on my short list. But meanwhile, I shall be sitting on my hands, trying to wait out this correction, awaiting either additional sales as my stocks decline or perhaps a purchase, if prices can turn around and I can get a buy signal with a sale of a portion of one of my holdings at a gain!
Thanks so much for stopping by. If you have any questions or comments, please feel free to leave them on the blog or email me at bobsadviceforstocks@lycos.com.
Bob
Wednesday, 26 October 2005
"Revisiting a Stock Pick" Digital Insight (DGIN)
Hello Friends! Thanks so much for stopping by and visiting my blog,
Stock Picks Bob's Advice. As always, please remember that I am an amateur investor, so please remember to consult with your professional investment advisors prior to making any investment decisions based on information on this website.

I was looking through the
list of top % gainers on the NASDAQ this morning, and noticed that Digital Insight (DGIN) had made the list. As I write, DGIN is trading at $28.99/share, up $2.07 or 7.69% on the day. I do not own any shares of DGIN nor do I own any options on this stock.
I first
posted DGIN on Stock Picks Bob's Advice on June 25, 2003, when it was trading at $17.96/share. Thus, we have a 'gain' on this selection of $11.03 or 61.4% since I first posted this stock almost 2 1/2 years ago!
According to the
Yahoo "Profile" on Digital Insight, the company "...provides outsourced online banking applications and services to banks, credit unions, and savings and loan associations."
As we often see around here, what drove the stock higher today, was the announcement after the close of trading yesterday of
3rd quarter 2005 earnings results. For the quarter ended September 30, 2005, revenues increased 12% to $53.2 million from $47.5 million for the same quarter last year. Net income for the quarter climbed 65% (using GAAP...generally accepted accounting practices as the news story states), to $6.8 million or $.19/diluted share, up from $4.1 million or $.12/diluted share the prior year. In addition, at least according to the headline of the article, the company increased 2005 eps guidance. I don't see any details on this guidance change within the article itself.
How about longer-term results? Looking at the
"5-Yr Restated" financials from Morningstar.com we can see a very pretty picture of sustained revenue growth from $54.4 million in 2000 to $200.4 million in the trailing twelve months (TTM).
Earnings-wise, the company was losing money at $(2.35)/share in 2000, turned profitable in 2003 at $1.38, dropped to $.47/share in 2004 and has increased to $.57/share in the TTM. Hopefully, this inconsistent earnings picture, not very unusual in these small companies, will change into a more steady picture of both revenue and earnings growth.
According to Morningstar.com, free cash flow has been postive and steadily increasing the past few years with $11 million reported in 2002 increasing to $40 million in the TTM.
The balance sheet is also very solid with $82.2 million in cash, enough to pay off both the $43.4 million in current liabilities and the $7.4 million in long-term liabilities combined almost twice over. In addition, the company has $53.1 million in other current assets per Morningstar.
Looking for some valuation parameters from
Yahoo "Key Statistics" on DGIN, we can see that this company is a smallish mid cap stock with a market capitalization of $987.94 million. The trailing p/e is a bit rich at 51.35, and the forward p/e (fye 31-Dec-06) is a tad better at 29.60. The PEG also suggests a rather rich valuation with a 1.78 statistic.
Looking at the
Fidelity.com eresearch website for DGIN, we find that the company has been assigned to the "Consumer Services" industrial group, and within this group DGIN tops out the list with a Price/Sales ratio of 4.8. This is followed by 4Kids Entertainment (KDE) at 2.4, Chemed (CHE) at 1.3, Ace Cash Express (AACE) at 1.1, and Central Parking (CPC) at 0.5. I am not sure that these particular companies are necessarily a good comparison for DGIN, but that is the grouping by Fidelity!
Looking for some additional numbers from Yahoo, the company has 34.06 million shares outstanding. Currently, there are 1.53 million shares out short, representing 5% of the float or 4.2 trading days of volume (the short ratio). Thus, using my 3 day rule, this is a bit of a factor supporting the stock price, especially with the good news on earnings released.
No cash dividend, and no stock dividends are reported by Yahoo.
What about a chart? Taking a look at the
"Point & Figure" chart from Stockcharts.com on DGIN:
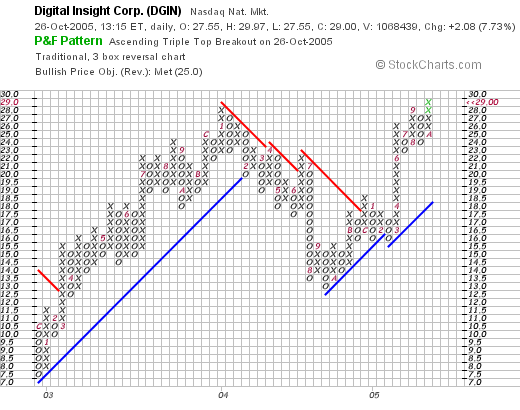
We can see that the stock was moving ahead steadily December, 2003, when it was trading at around $7.00/share to an intermediate top around $28 in January, 2004. The stock subsequently declined to $13 level in September, 2004, and has been trading higher once again, exceeding its prior high price with the current level of around $29. It is interesting to see the tracking between the decline in earnings in 2004 to the sell-off in the stock price, and once again, as earnings resume their rise, the stock moves ahead with the news!
So what do I think? Well, I find the entire field of internet banking intriguing. Apparently this stock is in the middle of this phenomenon. The latest earnings were great, the five year Morningstar view on revenue growth was great, the free cash flow is nice, the balance sheet is solid, and the chart looks encouraging.
However, on the downside, the p/e is certainly rich at just over 50, the PEG is also high just under 2.0, and the Price/Sales is at the tops of its particular (?) industrial group. Thus, I am not the first to discover this stock :(. However, the opportunity still looks attractive, and as long as the company continues to grow earnings and revenue at the nice clip it is currently doing, well, valuation might even start coming into line!
Thanks so much for stopping by! I hope you find my chatter informative; please do let me know what you think of what I write! If you have any conmments or questions, please feel free to leave them right on the blog or email me at bobsadviceforstocks@lycos.com.
Bob
Newer | Latest | Older


