Stock Picks Bob's Advice
Saturday, 26 August 2006
"Looking Back One Year" A review of stock picks from the week of April 25, 2005

Hello Friends! Thanks so much for stopping by and visiting my blog, Stock Picks Bob's Advice! As always please remember that I am an amateur investor, so please remember to consult with your professional investment advisors prior to making any investment decisions based on information on this website!
I am glad to be back blogging after being away for a couple of weeks. Thank you so much for rechecking with me after my absence. I know so little about all of you readers but I assume there are some of you who regularly stop by to read what I have to write. For all of you regulars, your loyalty is appreciated. For those of you who are new to this website, well welcome and make yourself at home!
One of those things that I regularly try to do around here is to review past stock picks and find out how they turned out. This review assumes a "buy and hold" strategy assuming buying equal dollar amounts of the stock picks the day they were selected and holding without concern for stock appreciation or loss. This isn't what I actually recommend for my own stock purchases. I employ a disciplined buying and selling strategy involving the quick sale of declining stocks at an 8% loss and the partial sales of gaining stocks at targeted appreciation points. However, for the sake of this review, and to continue my past review practices, this is what I use for evaluation.
I should also point out that when I started this review process some years back (!), I actually was a year out. Missing weeks here and there, I am now, as you can see, almost 1 1/2 years out from my picks and reviews.
 On April 29, 2005, I posted CNS (CNXS) on Stock Picks Bob's Advice when it was trading at $18.09. CNXS closed at $27.88 on August 25, 2006, for a gain of $9.79 or 54.1% since posting.
 On August 2, 2006, CNXS reported 1st quarter 2007 results. Net sales came in at $29.3 million for the quarter, up 25% from $23.5 million the prior year. Net income, however, for the quarter came in at $3.5 million or $.24/diluted share down from $4.0 million or $.27/share in the same quarter last year. Certainly the growth in revenue was solid, as has been the stock performance since my "pick"; however, due to the decline in earnings, I have to assign this stock a "thumbs-down". (Stocks only get "thumbs-up" on these reviews if both the earnings and revenue have improved.
 On April 27, 2005, I posted Hologic (HOLX) on Stock Picks Bob's Advice when it was trading at $35.85. HOLX had a 2:1 stock split December 1, 2005 and another 2:1 stock split March 26, 2006. Thus, my effective pick price was actually $35.85 x 1/2 x 1/2 = $8.96. HOLX closed at $42.21 on August 25, 2006, for a gain on this pick of $33.25 or 371%! (Every once in a while it is nice to smack one out of the park!)
 On July 25, 2006, Hologic announced third quarter fiscal 2006 results. Revenues totalled $119.7 million, a 62% increase over revenues of $74 million in the same quarter in 2005. Net income came in at $12 million or $.25/share, up sharply from $8.2 million or $.18/share reported in the same quarter in 2005.
So how did we do during that week picking stocks? Well in a word, PHENOMENAL! (I do not always do so well, but it is nice to have a great week picking stocks don't you think? Please remember that I am an amateur and that past performance is NOT a guarantee of future performance!) I had two stocks that week, one gained 54.1% and the other gained 371%, for an average appreciation of 212.5%. What a week that was. If only investing was always that successful!
Thanks again for visiting! I am glad to be back blogging and look forward to your comments, questions, and thoughts, at bobsadviceforstocks@lycos.com. Also, when you get a chance, stop by and visit my Stock Picks Podcast Site where you can also hear me talk about many of the same stocks I write about here on the blog. Regards!
Bob
Monday, 21 August 2006
A Short Break....back in a few days
Friends, I am away from my computer for a few days. I haven't posted for a week....but I shall be back and ready to go in a while. Regards and I promise to be back blogging this time next week!
Bob
Monday, 14 August 2006
August 14, 2006 Sonic Corp. (SONC)
Hello Friends! Thanks so much for stopping by and visiting my blog, Stock Picks Bob's Advice! As always, please remember that I am an amateur investor, so please remember to consult with your professional investment advisors prior to making any investment decisions based on information on this website.
The market is up strongly today on news that the cease-fire in the middle east appears to be holding. As I write, the Dow is up 97.89 at 11,185.92, and the NASDAQ is at 2087.35, up 29.64. Hopefull the move towards a peaceful resolution will hold, and oil prices will continue to pull back.
I was looking through the list of top % gainers on the NASDAQ earlier today and came across Sonic Corp. (SONC) which is currently trading at $21.75, up $2.02 or 10.24% on the day. I do not own any shares of Sonic nor do I have any options on this stock.
 What appears to be driving the stock higher today was the announcement on Friday of a potential 'buy-back' of up to 30% of the outstanding shares by the company. I found this news story that explains some of the reasons why companies buy back their shares. This article points our the three main reasons why a company buy-back is helpful in boosting share prices of its stock: 1) with less shares outstanding, earnings per share are boosted numerically, 2) the buy-back is in itself a form of purchasing support for the price...the old supply and demand principle, driving stock prices higher, and 3) the buy-back demonstrates management confidence in the value of the stock price itself. In any case, the market liked the news, and the stock price is moving strongly higher today.
What exactly does this company do?
 According to the Yahoo "Profile" on SONC, Sonic
"...engages in the operation and franchising of a chain of quick-service drive-ins in the United States and Mexico. The company, through its subsidiary, Sonic Industries, Inc., serves as the franchiser of the Sonic restaurant chain. It’s another subsidiary, Sonic Restaurants, Inc., develops and operates the company-owned restaurants. As of August 31, 2005, Sonic Corp. had 3,039 Sonic Drive-Ins, including 574 Partner Drive-Ins and 2,465 Franchise Drive-Ins."
How did Sonic do in the latest reported quarterly result?
On June 20, 2006, Sonic reported 3rd quarter 2006 results. For the quarter ending in May, 2006, sales grew 11% to $186.5 million from $167.7 million last year. Net income came in at $23.8 million, or $.27/share, up from $21.3 million or $.23/share in the same period in 2005. According to the news story, analysts per Thomson Financial had forecast earnings of $.26/share on revenue of $189.7 million. Thus, the company beat expectations on the earnings side and under-performed on revenue growth. Same-store sales increased 4.3% during the quarter. Providing some guidance, Sonic forecast profit of $.28 to $.29/share in the upcoming 4th quarter. This was a little ahead of the $.28/share which had been the consensus of analysts. Thus the company raised guidance.
How about longer-term financial results?
When we review the Morningstar.com "5-Yr Restated" financials on SONC, we can see a very nice picture of steady revenue growth with $331 million reported in 2001, steadily increasing to $623 million in 2005 and $676 million in the trailing twelve months (TTM).
Earnings have also been steadily improving with $.41/share reported in 2001 increasing to $.81/share in 2005 and $.89/share in the TTM.
The number of shares outstanding, which will apparently be decreasing, has been steady with 89 million in 2001, 90 million shares in 2005 and 85 million in the TTM.
Free cash flow is also impressive, with $36 million in 2003, increasing to $46 million in 2005 and $52 million in the TTM.
SONC's balance sheet is the only area of question on this page imho. The company has $25.4 million in cash and $29.5 million in other current assets. This is not in itself enough to cover the $80.7 million in current liabilities, and the resultant 'current ratio' works out to an anemic .68. Generally, a ratio of 1.5 is considered healthy as this review points out. In light of the healthy and growing free cash flow, this doesn't appear to be a big problem for Sonic, but it is something we shouldn't ignore either.
What about some Valuation Numbers for this stock?
Reviewing Yahoo "Key Statistics" on Sonic, we can see that this company is a mid-cap stock with a market capitalization of $1.86 billion. The trailing p/e is a moderate 24.29, with a forward p/e (fye 31-Aug-07) estimated at an even more reasonable 21.31. The PEG ratio is estimated by Yahoo at 1.28 (5 yr expected results). Generally, PEG ratios between 1.0 and 1.5 are "reasonable", under 1.0 are great, and over 1.5 are less attractive. This is a brief review of this ratio.
Using information from the Fidelity.com eresearch site on SONC, we can see that Sonic is in the "Restaurants" industrial group. Within this group, as measured by the Price/Sales ratio, Sonic is richly valued, leading the group with a ratio of 2.6, this is followed by McDonald's (MCD) at 2, Applebee's (APPB) at 1.1, Darding Restaurants (DRI) at 0.9, Brinker (EAT) at 0.7, and OSI Restaurant Partners (OSI) at 0.6.
Insofar as profitability is concerned, if we look at the Return on Equity (ROE) figures, we find that Sonic fortunately is one of the more profitable restaurants with an ROE of 21.1%. This is exceeded by Darden at 27.1% and following Sonic is Applebee's at 20%, McDonald's at 18.5%, Brinker at 18.2% and OSI at 10%.
Finishing up the Yahoo numbers, we see that there are 85.4 million shares outstanding with 81.93 million that float. Currently, there are 6.25 million shares (7/11/06) out short, representing 7.70% of the float or 7.2 trading days of volume. This short ratio over 3, is in my opinion, significant. Thus, with the stock moving higher today on an announcement of a stock buy back, these traders who have already sold shares and are looking to buy cheaper, might well be "squeezed" by the buying pressure.
No cash dividend is reported on Yahoo and the last stock split was a 3:2 split, just happening, on May 1, 2006.
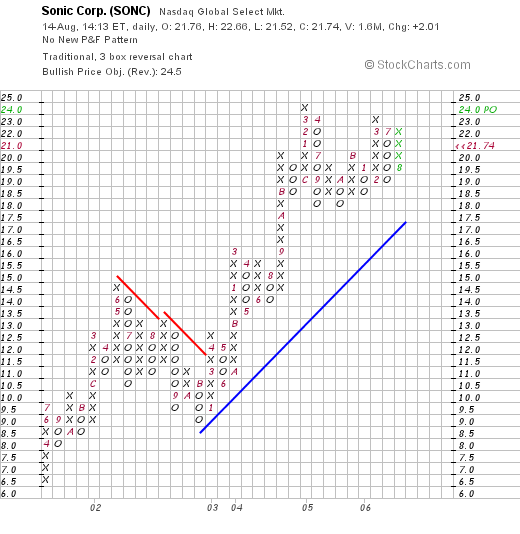
And what does the chart look like?
If we review the "Point & Figure" chart on Sonic from StockCharts.com, we see what appears to me to be a strong graph, which, after some mild weakness in 2002, when the stock fell from $14.50 in June to a low of $8.50 in November, the stock has been trading steadily higher, currently approaching but under its high of $24.00 hit in March, 2005. The chart looks just fine to me.
Summary: So what do I think of this stock?
Let's review some of the above discussion. First of all the stock is moving higher on a nice announcement of a big stock buy-back from management. Less shares outstanding should mean better results, and the buying pressure in itself could help push this stock higher. Next, the latest quarter was reasonably strong with earnings exceeding expectations but revenue coming in a little light. The Morningstar.com shows steady revenue and earnings growth and nice free cash flow improvement. However, the balance sheet leaves a little to be desired with a current ratio under 1.0 and a significant level of long-term liabilities as well.
Valuation is ok with a rich Price/sales but a nice return on equity figure. Another attractive point is the high level of the short interest which may well be continued to be "squeezed" by the stock buy back. Finally, the chart looks quite nice to me.
These are the reasons I thought the stock deserved to be on the blog. I am not buying any shares, but I have now added this company to my "investing vocabulary"...those stocks that may well be 'investable' given the appropriate portfolio management signals that might lead to me adding a new position!
Thanks so much for visiting! If you have any comments or questions, please feel free to leave them on the blog or email me at bobsadviceforstocks@lycos.com. Please give my Stock Picks Podcast a listen as well!
Bob
Saturday, 12 August 2006
"Looking Back One Year" A review of stock picks from the week of April 18, 2005

Hello Friends! Thanks so much for stopping by and visiting my blog, Bob's Advice for Stocks! As always, please remember that I am an amateur investor, so please remember to consult with your professional investment advisors prior to making any investment decisions based on information on this website.
One of the tasks I try to accomplish each weekend is to look back at past stock selections and see what happened after I posted them to the blog. For ease of performance calculation, I assume a "buy and hold" strategy to this approach. In fact, in practice I utilize and recommend a more disciplined trading approach to stocks; selling losing stocks quickly and completely, and selling gaining issues slowly and partially. This difference would obviously change the performance evaluation. But for the purposes of this weekend review, the 'buy and hold' strategy works just fine!
 On April 18, 2005, I posted Too, Inc. (TOO) on Stock Picks Bob's Advice when it was trading at $23.74. In July 10, 2006, Too, Inc. changed its name to Tween Brands (TWB) and started trading under the new stock symbol. TWB closed at $35.98 on 8/11/06, for a gain of $12.24 or 51.6% since posting.
On May 17, 2006, what was then called "Too, Inc." reported 1st quarter 2006 results. For the quarter ended April 29, 2006, net sales increased 19% to $195.1 million, up from $164.4 millionduring the same period last year. Net income climbed 67% to $.35/diluted share from $.21/diluted share last year. This was $11.7 million this year and $7.4 million of net income in the prior year same period. Comparable store sales increased 10% during the quarter with 9% increase for Limited Too stores and a 30% increase for the 46 Justice stores open during both periods. Another plus imho for the stock was that during the quarter, the company repurchased about 630,000 shares.
 On April 20, 2005, I posted St. Jude Medical (STJ) on Stock Picks Bob's Advice when the stock was trading at $39.67. STJ closed at $33.68 on 8/11/06, for a loss of $(5.99) or (15.1)% since posting.
On July 19, 2006, St. Jude Medical announced 2nd quarter 2006 results. For the quarter ended June 30, 2006, net sales came in at $833 million, up 15% from $724 million reported in the same quarter in 2005. Net earnings were $141 million or $.38/diluted share compared with $101 million or $.27/diluted share in the previous year. On a down note, the same day the company cut its estimates for the year reporting:
"Updating its forecast, St. Jude expects consolidated earnings for the third quarter to be in the range of 36 cents to 39 cents a share, and full-year profit to be in the range of $1.49 to $1.55 a share. In April, the company forecast a consolidated profit of $1.55 to $1.60 for the year."

Finally, on April 21, 2005, I posted Meridian Bioscience (VIVO) on Stock Picks Bob's Advice at a price of $16.265. On September 6, 2005, Meridian split 3:2 making my effective pick price actually $10.84. VIVO closed on 8/11/06 at $19.50/share for a gain of $8.66 or 79.9% since posting!
On July 20, 2006, VIVO reported 3rd quarter 2006 results. For the three months ended June 30, 2006, net sales increased 5% to $26.6 million from $25.4 million in the same quarter in the previous year. Operating incomecame in at $6.9 million, up 21% from $5.7 million last year. The company also raised guidance for 2007 sales to $106 to $109 million from the previous guidance of $103 to $107 million. Per share earnings guidance were also increased to $.63 to $.66/share, up from the prior guidance of $.60 to $.63/share. Overall, a nice earnings report for Meridian!
So how did I do for that week a little over a year ago? Pretty darn good actually. Two gaining stocks and one losing stock for an average gain of 38.8% on these stocks assuming equal dollar purchases and a "buy and hold" strategy!
Thanks so much for stopping by and visiting! If you have any comments or questions, please feel free to leave them on the blog or email me at bobsadviceforstocks@lycos.com. Also, please be sure and visit my podcast site.
Bob
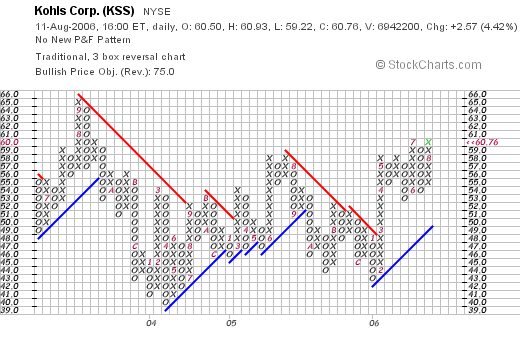
Kohl's (KSS)
Hello Friends! Thanks so much for stopping by and visiting my blog, Stock Picks Bob's Advice. As always, please remember to consult with your professional investment advisors prior to making any investment decisions based on information on this website.
 Here is an entry that I really intended to get to yesterday, but one thing led to another....same old story I guess! Kohl's (KSS) had a great day yesterday, closing at $60.76, up $2.57 or 4.42% on the day. I do own some shares of KSS in a managed account that I do not direct.
What exactly does the company do?
According to the Yahoo "Profile" on Kohl's, the company
"...operates specialty department stores in the United States. Its stores sell apparel, footwear, accessories, and beauty products for women, men, and children, as well as soft home products, such as towels, sheets and pillows, and housewares."
How did Kohl's do in the latest quarterly earnings report?
As is often the case, the stock rose Friday after the company announced 2nd quarter earnings after the close of trading Thursday. For the quarter ended July 29, 2006, net sales for the quarter grew 14% to $3.3 billion from $2.9 billion. Earnings jumped 27.8% to $.69/share, up from $.54/share the same quarter last year.
A couple of points about the earnings report: first of all, the company reported on their same store sales which climbed 5.5% in the quarter. This is reasonably strong and reproducible same store sales growth number. The report was good because it was what I call a "trifecta-plus"....that is the company increased revenue and earnings, beat expectations, and also raised guidance. Everything one could want in an earnings report!
According to this report, the company, which came in at $.69/share, exceeded analysts expectations of only $.65/share. In addition, Kohl's raised guidance to $3.04 to $3.13/share for the year, up from previous guidance of $2.91 to $3.02.
How about longer-term financial results?
Reviewing the Morningstar.com "5-Yr Restated" financials, we can see that Kohl's has steadily grown its revenue from $7.5 billion in 2002 to $13.4 billion in 2006 and $13.8 billion in the trailing twelve months (TTM).
Except for a slight dip in earnings between 2003 and 2004, when earnings dropped from $1.75 to $1.59, the company has been growing its earnings from $1.35/share in 2002 to $2.43/share in 2006 and $2.55/share in the TTM.
The number of shares outstanding has been fairly steady with 335 million in 2002, growing to 344 million in 2006 and dropping back to 340 million in the TTM.
Free cash flow, which was a negative $(92) million in 2004, improved to 47 million in 2005 and $82 million in 2006. Morningstar reports a huge increase in free cash flow in the TTM at $1.8 billion.
The balance sheet, as presented on Morningstar.com, looks solid with $1.6 billion in cash and a total of $4.1 billion in current assets. When compared to the $1.6 billion in current liabilities, this yields a current ratio of 2.52. The company can easily pay off all of its liabilities with all of its current assets.
How about some valuation numbers and statistics on the company?
Reviewing the Yahoo "Key Statistics" on KSS, we see that this is a large cap stock with a market capitalization of $20.69 billion. The trailing p/e is a moderate 23.85 with a forward p/e (fye 28-Jan-08) of only 16.97. However, the growth rate in the earnings (5 yr expected) is adequate to give us a PEG of .89.
Looking at the information on the Fidelity.com eresearch site, we can see that Kohl's is in the "Department Stores" industrial group. Within this group, Kohl's is relatively richly priced relative to similar companies. Topping this group is Federated Department Stores (FD) with a Price/Sales ratio of 1.6, this is followed by Kohl's (KSS) at f1.5, J. C. Penney (JCP) at 0.8, Saks (SKS) at 0.4 and Dillard's (DDS) at .3.
Insofar as profitability is concerned, at least as measured by return on equity (ROE), this measure is led by J.C.Penney at 25.4%, followed by Kohl's at 15.4%, Federated Department Stores at 10.1%, Dillard's at 6.2%, and Saks (SKS) at 4.3%.
Finishing up with Yahoo, we find that there are 340.44 million shares outstanding and 308.51 million of them that float. Currently (7/11/06) there are 9.93 million shares out short representing 3.20% of the float or 2.8 trading days. This does not rise to my cut-off of 3 days of short interest for significance. No cash dividend and the last stock split was a 2:1 split April 25, 2000.
What does the chart look like?
Examining the "Point & Figure" chart on KSS from StockCharts.com, we see a chart just moving sideways. Since September, 2003, when the stock hit a peak of $65/share, down to a low of $39/share in March, 2004, the stock has zigged and zagged between these two extremes. With the latest quarterly report and the strong move Friday, Kohl's appears to be poised to move into higher ground. Of course, time will tell, but I like the overall optimistic appearance of the stock price.
Summary: What do I think of this stock?
This company appears to be doing everything right in an overall challenging retail and economic environment. A few years back, the company appeared to be stumbling badly with their California expansion. However, with the latest financial report, the company is now 'firing on all cylinders'. They have steady same store sales growth, they are beating expectations and raising guidance! And the street is responding to the good news bidding up the stock price.
 The Morningstar.com report appears solid with steady revenue and earnings growth and a recent surge in free cash flow. The number of shares outstanding is quite stable and the balance sheet is solid. Valuation appears reasonable, especially the PEG under 1.0.
In a nutshell, I like this stock :). I do own some shares, so that may color my perspective, but that decision was made independent of my input.
Am I buying any shares? My trading strategy does not direct me to be buying anything at this time. But it is the kind of stock that I might buy if I were in the market to purchase shares.
Thanks again for visiting! If you have any comments or questions, please feel free to leave them on the blog or email me at bobsadviceforstocks@lycos.com. Also, be sure to stop by and visit my Stock Picks podcast site.
Bob
Tuesday, 8 August 2006
"Revisiting a Stock Pick" inVentiv Health (VTIV)
CLICK HERE FOR THE INVENTIV PODCAST
Hello Friends! Thanks so much for stopping by and visiting my blog, Stock Picks Bob's Advice. As always, please remember that I am an amateur investor, so please remember to consult with your professional investment advisors prior to making any investment decisions based on information on this website.
 I was looking through the list of top % gainers this evening and I came across an old favorite of mine inVentiv Health (VTIV) that had traded strongly higher today, in fact closing at $29.88, up $2.89 or 10.71% on the day in an otherwise weak stock market. I do not personally own any shares of this stock but my son does own 40 shares of VTIV in an account that I manage for him. This company, which used to be called Ventiv Health, formally changed its name to inVentiv Health (VTIV), a act approved by shareholders on June 16, 2006.
I first posted Ventiv Health on Stock Picks Bob's Advice exactly one year ago on August 8, 2005, when the stock was trading at $24.19. With today's close at $29.88, this represents an appreciation of $5.69 or 23.5% since posting. Let's take another look at this stock and I will try to share with you my thoughts why this company deserves a spot on this blog.
First of all, what they do?
According to the Yahoo "Profile" on inVentiv, the company:
"...provides commercialization services to the pharmaceutical and life sciences industries in the United States and internationally. It operates through three segments: inVentiv Clinical, inVentiv Communications, and inVentiv Commercial."
And how about the latest quarterly report?
Actually, it was the earnings report announced just before the opening of trading that pushed the stock higher today. This morning, VTIV announced 2nd quarter 2006 results. For the three months ended June 30, 2006, total revenue increased 39% to $183.0 million in the second quarter of 2006 compared to $131.8 million for the same quarter in 2005. Net income increased 100% from $10.5 million to $21 million this year. Net income increased almost 100% to $.69/share, up sharply from $.38/diluted share the prior year. Also adding to the bullish sentiment on the stock was the announcement today of a multiyear contract with Novartis pharmaceuticals Corp. All-in-all a very nice day for this company!
How about longer-term results?
For this, the Morningstar.com "5-Yr Restated" financials report on VTIV is most helpful. On this page, we can see that revenue results, which first declined from $294.8 million in 2001 to $215.4 million in 2002, has since been increasing steadily to $556.3 million in 2005 and $609.1 million in the trailing twelve months (TTM).
Earnings, which were at a loss of $(2.58) in 2001, improved to $.35/share in 2002, then dipped to $.24/share in 2003. However, since 2003, earnings have climbed strongly to $1.56/share in 2005 and $1.57/share in the TTM. The latest quarter just commented on continues this strong growth record.
The company has increased its shares slightly from 23 million in 2001 to 27 million in 2005 and 29 million in the trailing twelve months.
Free cash flow has been improving steadily the past few years from $13 million in 2003 to $49 million in 2005 and $68 million in the TTM.
Looking at the balance sheet as reported on Morningstar.com, we find VTIV with $43.9 million in cash and $172.5 million in other current assets. This combined $216.4 million, when compared to the $127.4 million in current liabilities yields a current ratio of 1.7. In addition, the company $205.4 million in long-term liabilities. While the level of liabilities appears manageable imho, there are stronger balance sheets on the stocks we have reviewed elsewhere. However, with the growing free cash flow, this really doesn't seem to be a problem for this company.
What about some valuation numbers?
Reviewing the Yahoo "Key Statistics" on VTIV, we find that the company is a small mid-cap stock with a market capitalization of only $871.24 million. The trailing p/e is a very reasonable 19.06 imho, with a forward p/e (fye 31-Dec-07) of only 17.79. The PEG ratio (5 yr expected) is reported at 1.27.
According to the Fidelity.com eresearch website, VTIV is in the "Management Services" industrial group. Within this group, VTIV has a reasonable Price/Sales ratio of only 1.3. Topping this group is Ceridian (CEN) with a Price/Sales ratio of 2.3. This is followed by Heidrick & Struggle (HSII) at 1.5, Accenture (ACN) at 1.4 and then inVentiv at 1.3. Companies with lower Price/Sales ratio than Ventiv include Hewitt Associates (HEW) at 0.8, and Bearing Point (BE) at 0.5.
inVentiv is also one of the most profitable (as measured by the higher return on equity) stocks in this group with a ROE of 18%. Topping the group is Accenture at 62.2%. After inVentiv is Heidrick & Struggle at 16.9%, Ceridian at 10.9%, Hewit Associates at 10.3% and Bearing Point at a negative (53.7)%.
Returning to Yahoo, we see that there are 29.16 million shares outstanding with only 27.50 million that float. Currently there are 1.91 million shares out short (as of 7/11/06), representing 7% of the float or 8.9 trading days of volume. With today's excellent earnings report, the large number of shares out short (greater than my own 3 day short interest rule), this may well have been a bit of a squeeze on all those shorts scrambling to cover their pre-sold shares with new purchases of this stock! Just a thought :).
No cash dividend is paid and no stock split is reported on Yahoo.
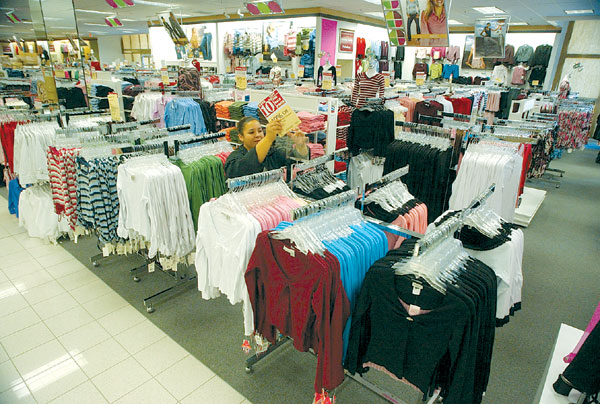
What does the chart look like?
If we take a look at the "Point & Figure" chart on VTIV from StockCharts.com, we can see that the chart, which was declining though 2001 and 2002, turned around in 2003 and moved sharply higher. This coincides with the turn-around in earnings which once again emphasizes the close relationship between earnings performance and stock price imho. Since breaking through resistance in September, 2003, at $8.00/share, the stock has been trading very steadily higher to its current level around $29.88, a little below its recent high of $33 made in March, 2006.
Summary: 'So what do I think about this stock?'
Let's review some of the things I have discussed in this blog entry. First of all, the stock moved higher today in an otherwise anemic trading day. A plus. The company did this on a strong earnings report and the announcement of a multiyear contract with Novartis. Both pieces of good news.
Longer-term, the Morningstar.com "5-Yr Restated" financials look strong with steady five year revenue and earnings growth (except a dip 3 or 4 years ago). Earnings have been expanding strongly the past several years as well. The company is releasing a few shares the past few years, but certainly the financial reports have been staying ahead of the expanded float. Free cash flow is positive and growing strongly. The balance sheet is adequate if not fabulous.
Finally, valuation is reasonable with a p/e in the teens, a PEG just over 1.2, and a relatively reasonable Price/Sales ratio with a strong ROE.
In addition, the graph shows a strong upward movement to the stock price. Helping this along today appears to be a relatively large short interest of investors betting against this company.
In conclusion, I like this stock. I am not in the market to be purchasing any but I have bought just a few shares for my son this past year. Thanks so much for stopping by and visiting my blog! If you have any comments or questions, please feel free to leave them on the blog or email me at bobsadviceforstocks@lycos.com. Also, please remember to drop by and visit my Stock Picks Bob's Advice podcast site, where you can hear me drone on and on, if reading me wasn't enough. jk.
Bob
Posted by bobsadviceforstocks at 8:54 PM CDT
|
Post Comment |
Permalink
Updated: Tuesday, 8 August 2006 10:17 PM CDT
Saturday, 5 August 2006
Morningstar (MORN) "Weekend Trading Portfolio Analysis"
CLICK HERE FOR MY PODCAST ON MORNINGSTAR

Hello Friends! Thanks so much for stopping by and visiting my blog, Stock Picks Bob's Advice! As always, please remember that I am an amateur investor, so please remember to consult with your professional investment advisors prior to making any investment decisions based on information on this website.
Over the past year or so, I have been trying to review my actual holdings in my trading portfolio on weekends. These are the stocks that I actually own and that I try to be as transparent as possible letting you know what I own, when I buy it, and when I sell it. Sometimes my trades appear brilliant, and other times, like the latest trade in Kendle, I share with you my failures. Hopefully, together we shall continue to learn about investing!
 On June 25, 2006, I reviewed my Kyphon stock here on the blog. Going alphabetically through my smaller list of 11 positions, I am up to Morningstar (MORN), a stock that I own which is also the website that I use regularly in evaluating my stock picks.
Currently, I have 167 shares of Morningstar. These shares were purchased 11/22/05 with a cost basis of $32.57/share. With the stock closing 8/4/06 at $36.13, I have an unrealized gain of $3.56 or 10.9% on this purchase. The stock has been under pressure recently, and in fact, closed Friday at $36.13, down $(2.61) or (6.74)% on the day. Let's take a closer look at this stock, my history with this investment, and whether it still looks attractive to purchase.
My initial purchase of Morningstar was on 11/22/05, when I purchased 200 shares of the stock. I sold 33 shares of MORN on 2/16/06 with proceeds of $42.94/share, representing a gain of $10.37 or 31.8% since purchase. This was my first targeted gain at approximately a 30% appreciation, and thus, my next targeted sale on the upside would be at about a 60% gain or 1.60 x $32.57 = $52.11/share. On the downside, after one targeted sale at a gain, my sale point moves up from the (8)% loss level to break even or $32.57/share.
Let's take a closer look at this stock--first of all, what does this company do?
According to the Yahoo "Profile" on MORN, the company
"...provides independent investment research to investors worldwide. It offers Internet, software, and print-based products for individual investors, financial advisors, and institutional clients, as well as asset management services to advisors and institutions. It operates through three segments: Individual, Advisor, and Institutional."
I certainly can attest to the usefulness of the Morningstar material; I have been using "5-Yr Restated" statements from Morningstar since I have started this blog, long before I ever owned any shares!
How about the latest quarter?
On August 3, 2006 (just a couple of days ago), Morningstar reported 2nd quarter 2006 results. For the three months ended June 30, 2006, consolidated revenue came in at $76.3 million, a 36% increase from the same quarter the prior year. Net income for the quarter worked out to $11.2 million, or $.24/diluted share, up from $9.5 million, or $.22/diluted share in the same period the prior year.
How about longer-term results?
Reviewing the "5-Yr Restated" financials from Morningstar.com on MORN :), we can see the steady growth in revenue from $91.2 million in 2001 to $227.1 million in 2005 and $244.0 million in the trailing twelve months (TTM).
Earnings/share have improved from a loss of $(.32)/share in 2001 to a profit of $.21/share in 2004, $.70/share in 2005, and $.90/share in the TTM. During this time, the number of shares have fluctuated but are fairly stable with 39 million shares in 2001, 39 million shares in 2005, increasing slightly to 41 million shares in the TTM.
Free cash flow has been growing nicely with $21 million reported in 2003, increasing to $41 million in 2005 and $53 million in the TTM.
The balance sheet looks ok, especially with the low level of long-term debt, but the cash of $82.9 million and the other current assets of $68 million, when compared to the $123.1 million in current liabilities yields a rather anemic current ratio of 1.23. Generally a current ratio between 1.0 and 1.5 is considered acceptable. This is probably ok as I noted because the long-term debt for MORN is listed as only $4.8 million.
What about some valuation numbers?
Reviewing the Yahoo "Key Statistics" on Morningstar, we find that the company is a mid-cap stock with a market capitalization of $1.47 billion. The trailing p/e is a bit rich at 40.37, but the forward p/e is a bit better (fye 31-Dec-07) of 24.09. I cannot find a PEG on Morningstar either on the Yahoo or the Fidelity website.
Reviewing the Price/Sales ratio from the Fidelity.com eresearch website, we find that MORN is in the "Asset Management" industrial group. Morningstar is the most expensive in this group as measured by this ratio with a Price/Sales of 6.9. This is followed by T. Rowe Price (TROW) at 6.8, Franklin Resources (BEN) at 5.3, Federated Investors (FII) at 3.5, Janus (JNS) at 3.2, and Principal Financial Group (PFG) the most reasonably priced with a Price/Sales ratio of only 1.5.
Fortunately, Morningstar is also one of the most profitable of the group with a Return on Equity (ROE) of 24%. This is exceeded by Federated Investors (FII) at 39.6%, and followed by T. Rowe at 23.5%, Franklin Resources at 18.7%, Principal Financial at 13%, and Janus at 4.3%.
Finishing up with the Yahoo numbers, the company has 40.76 million shares outstanding but only 20.01 million that float. Of these, 1.06 million of these shares were out short as of 7/11/06, representing 10.5% of the float or 7.7 trading days of volume. Using my 3 day rule of significance, there is actually quite a few shares out short and the stock could rally with a 'squeeze' if good news was reported. Unfortunately, the recent earnings report was apparently not very impressive to those following this stock.
No cash dividends and no stock dividends are reported on Yahoo.
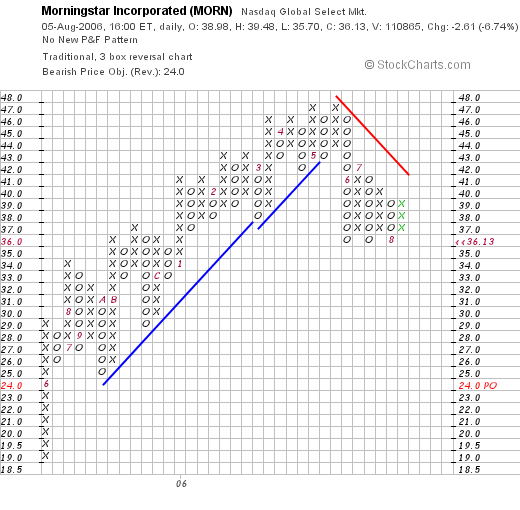
What about the chart? Does the recent correction in the stock price signify a break-down in the chart pattern?
If we examine the "Point & Figure" chart on Morningstar from StockCharts.com, we can see a very steady improvement in the stock price from $19 in May, 2005, to a peak of $47 in May, 2006. However, the stock does appear to have rolled-over and is now testing a "triple-bottom" short-term. I would be rather concerned if the stock breaks down below the current level. On the other hand, if the stock can rally back above $41, I shall be breathing easier :).
So what do I think? Well, I own the stock :). I have sold the stock once on a gain but the company is just above 10% ahead of my purchase price. Thus, with no fundamental news, if the stock drops by about 9% from here I shall be selling my position. On the other hand, the latest quarter was good, the Morningstar.com 5-yr report looks good to me as well, the free cash flow is positive and growing and the balance sheet looks reasonable if not spectacular. Valuation is a bit rich with a p/e over 40 so possibly investors are thinking that the stock was priced for perfection and did not actually deliver perfection in the latest earnings report.
So that's the next stock in my trading portfolio! I hope that you enjoyed my review of my experience with this stock and some of the current numbers. If you have any comments or questions, please feel free to leave them on the blog or email me at bobsadviceforstocks@lycos.com. Also, don't forget to visit my Stock Picks Bob's Advice podcast site.
Bob
Posted by bobsadviceforstocks at 3:58 PM CDT
|
Post Comment |
Permalink
Updated: Monday, 7 August 2006 7:14 AM CDT
"Looking Back One Year" A review of stock picks from the week of April 11, 2005

Hello Friends! Thanks so much for stopping by and visiting my blog, Stock Picks Bob's Advice. As always, please remember that I am an amateur investor, so please remember to consult with your professional investment advisors prior to making any investment decisions based on information on this website.
I hope you all are having a nice Saturday and that the week ahead is profitable and productive for you! Regular readers of my blog will realize that most weekends (?) I have been trying to review past selections on the blog and see how they would have done if I had indeed purchased shares in the stocks I discuss. For the sake of ease of analysis, I have been assuming a "buy and hold" investment strategy instead of the actual disciplined investment and portfolio management approach.
Rather than just buying and holding equities, I sell stocks quickly and completely on losses, and slowly and partially on targeted gains. This certainly will affect the result of purchasing such investments! But for our basic purposes, this analysis works just fine.
I continue to review past selections; however, after missing another weekend, my 'year-earlier' period is increasing by the week! Two weeks ago I reviewed the selections on the blog from April 4, 2005. Today, I would like to take a look at the next week: the week of April 11, 2005. Fortunately for me :), I only "picked" one stock that week: LoJack (LOJN). I do not own any shares nor do I have any options on this stock.
 On April 13, 2005, I picked LoJack (LOJN) for Stock Picks Bob's Advice when the stock was trading at $13.94. LOJN closed at $17.55 on 8/4/06, for a gain of $3.61 or 25.9% since posting.
On May 5, 2006, LoJack announced first quarter 2006 results. For the quarter ended March 31, 2006, revenue climbed 18% to $50.7 million from $43 million in the same quarter last year. Net income increased to $2.94 million from $2.64 million in the prior year. On a per share basis, this worked out to $.15/share, up from $.14/dilutedshare last year.
Since that was the only stock I reviewed that week, I feel safe to say that the average performance of stock picks that week was a gain of 25.9% since posting! Thank you for visiting! If you have any comments or questions, please feel free to leave them on the blog or drop me a line at bobsadviceforstocks.tripod.com. Please also be sure and visit my Stock Picks Bob's Advice podcast site.
Bob
Friday, 4 August 2006
August 4, 2006 Anaren (ANEN)
Hello Friends! Thanks so much for stopping by and visiting my blog, Stock Picks Bob's Advice. As always, please remember that I am an amateur investor, so please remember to consult with your professional investment advisors prior to making any investment decisions based on information on this website.
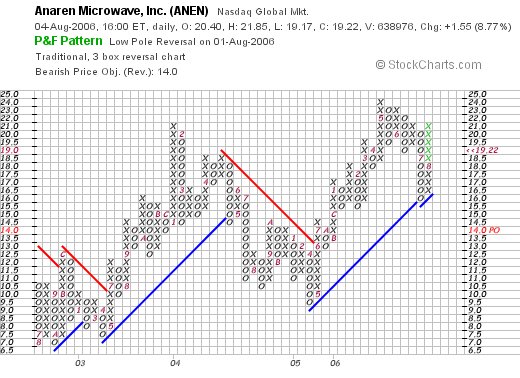
 Looking through the list of top % gainers on the NASDAQ this afternoon, I came across Anaren Microwave (ANEN) which closed at $19.22, up $1.55 or 8.77% on the day. I do not own any shares nor do I have any options on this stock.
According to the Yahoo "Profile" on Anaren, the company
"... engages in the design, development, and manufacture of microwave and radio frequency components, assemblies, and subsystems for wireless communications, satellite communications, and defense electronics markets."
This certainly is pretty high-tech stuff, and I don't think I can use my Peter Lynch strategy to pick stocks. But the numbers were pretty compelling so let's take a closer look at this company!
Like so many stocks on the move this time of year, the company moved sharply higher on the back of an earnings report. Yesterday, after the close of trading, Anaren announced 4th quarter 2006 results. For the quarter ended June 30, 2006, net sales came in at a record $29.1 million, up 21% over the $24.1 million in the same quarter the prior year. Net income worked out to $3.7 million or $.20/diluted share, up from $2.6 million or $.14/diluted share in 2005.
How about longer-term results?
If we review the Morningstar.com "5-Yr Restated" financials on ANEN, we can see that revenue actually dipped from $85 million in 2001 to $71 million in 2002 before resuming its climb to $94 million in 2005 and $100 million in the trailing twelve months (TTM).
Earnings also dipped from $.52/share in 2001 to $.16/share in 2003, before climbing to $.37/share in 2005 and $.56/share in the TTM.
I find it interesting and provocative to see that the outstanding shares which were 22 million in 2001, increase to 23 million in 2002, but then started declining....dropping to 20 million shares in 2005 and 17 million in the TTM. It is fairly rare to see a company retiring shares instead of increasing its float, but for the investor, this means a lower number of shares to spread the same earnings over, and thus pressure to the upside on earnings growth.
Free cash flow has been a bit erratic, with $8 million in 2003 reported, increasing to $11 million in 2004, then to a negative $(1) million in 2005 but a positive $9 million in the TTM.
The balance sheet, as reported on Morningstar, looks solid. $75.5 million in cash is reported, enough to easily pay off both the $10 million in current liabilities and the $6.5 million in long-term liabilities combined more than 4 times over. In fact, if we add in the $40.6 million in other current assets to the $75.5 million in cash, we have a sum of $116.1 million, which when compared to the $10 million in current liabilities yields a current ratio of 11.6, the highest current ratio on any stock I have reviewed as far as I can remember. This company appears from this exam to be quite solvent.
What about some valuation numbers?
Looking at the Yahoo "Key Statistics" on Anaren, we can see that this is a small cap stock with a market capitalization of only $330.37 million. The trailing p/e is a moderate 30.95, but the forward p/e is only 21.60 (fye 30-Jun-07), and the PEG (5 yr expected) isn't too bad at 1.38.
Checking the Fidelity.com eresearch website on Anaren, Fidelity has assigned them to the "Scientific/Tech Instruments" industrial group. In regards to the Price/Sales ratio, Anaren is relatively cheap with a ratio of 3.1. Topping this group is Garmin (GRMN) at 8.4, SiRF Technology (SIRF) at 5.9, Flir Systems (FLIR) at 3.8, Applied Biosystems (ABI) at 3.3, then Anaren at 3.1, and Beckman Coulter (BEC) at the cheapest ratio of 1.4.
Unfortunately, looking at profitability with a review of the 'return on equity' (ROE), ANEN is also at the bottom of the list with a ROE of 6.5%. Topping the list is Garmin (GRMN) at 30.8%, Flir at 24.7%, Applied Biosystems at 19.5%, Beckman Coulter at 11.4% and SiRF at 7%.
Finishing up with Yahoo, ANEN has only 17.19 million shares outstanding with 16.33 million that float. As of 7/11/06, there were 758,560 shares out short representing 4.60% of the float or 5.9 trading days of average volume (the short ratio). No cash dividends and no stock splits are reported.
What about the chart?
Reviewing the "Point & Figure" chart on ANEN from StockCharts.com, we can see that the company has been moving higher from its lows of around $7 from October, 2002. The company did sell-off in 2004 down to a low of $9.50, but since April, 2005, the stock has been moving steadily higher to the current level of around $19.22, a little under the highs of $24.00 in May, 2006. The chart looks relatively strong to me without appearing over-extended.
So what do I think? Well, the stock moved nicely higher today on the back of a terrific earnings report. Looking at Morningstar.com, this report is part of a longer trend of earnings and revenue growth. Free cash flow is positive recently, the company is reducing its outstanding shares, and the balance sheet is gorgeous. The p/e is reasonable imho with a PEG under 1.5. The Price/Sales isn't bad, but the profitability as measured by ROE is a bit low. Finally, the chart looks nice.
I don't really understand the business that this company is in from an intuitive perspective. However, if I were in the market to be buying a stock, this is the sort of company I would be purchasing!
Thanks so much for stopping by! Please remember to drop me a line at bobsadviceforstocks@lycos.com if you have any comments or questions. Certainly feel free to leave a comment right on the blog. Also, be sure and visit my Stock Picks Bob's Advice podcast site! You can listen to me rant as well as read my rants whenever you like!
Bob
Thursday, 3 August 2006
"Revisiting a Stock Pick" Christopher & Banks (CBK)
CLICK HERE FOR MY PODCAST ON CHRISTOPHER & BANKS
Hello Friends! Thanks so much for stopping by and visiting my blog, Stock Picks Bob's Advice. As always, please remember that I am an amateur investor, so please remember to consult with your professional investment advisors prior to making any investment decisions based on information on this website.
 We have certainly had some tough days in the stock market recently! I haven't completely stayed with my investment strategy as you will see from my trading attempt with Kendle (KNDL). I always reserve the right to do something silly, and I managed to do just that. It isn't that I didn't like Kendle, it was just not part of my strategy to do a trade like that. And it didn't work out. So I am back to my plodding strategy that has been working a bit better than the old shoot from the hip approach!
 With the market trading a little better, I thought I would see if I couldn't find something to discuss this afternoon. Looking through the list of top % gainers on the NASDAQ today, I came across an old favorite of mine, Christopher & Banks (CBK), which, as I write, is trading at $29.44, up $1.30 or 4.62% on the day. I do not own any shares of this stock, nor do I own any options or other futures related to this company.
I say this is an "old favorite" because I have reviewed this stock previously on the blog. In fact, I first reviewed Christopher & Banks on Stock Picks Bob's Advice on June 5, 2003, when the stock was trading at $33.45. CBK had one stock split since that post on August 28, 2003, when the stock split 3:2. This results in an effective pick price for me of $22.30. Thus, with today's current stock price of $29.45, this means an effective appreciation of $7.15/share or 32.1% since posting.
And what does Christopher & Banks do? According to the Yahoo "Profile" on CBK, the company
"... operates retail specialty stores that sell women’s specialty apparel in the United States. It operates its retail stores under the Christopher & Banks, C.J. Banks, and Acorn names. Christopher & Banks stores offer fashions featuring co-ordinated assortments of sportswear and sweaters in sizes 4 to 16. C.J. Banks stores offer similar assortments of women’s specialty apparel in sizes 14W and up."
What drove the stock higher today, was the announcement of the 'all-important' same-store sales figures for July. When looking at retail companies like CBK, the same-store figure gives the investor a feeling for the 'organic' growth of the company; that is, by examining the performance of stores that have been open at least a year, we can take out the effect of opening new stores on the underlying growth results of the firm. This number can be considered a 'truer' criterion in examining sales results imho.
Basically, total sales for the five-week period ended July 29, 2006 "...increase 21% to $49.6 million from $41.1 million last year. July same-store sales rose 10%." In my expereience, anytime a retail firm can come in with high single-digit or low double-digit same-store sales increases, we have a great result. In addition, since same-store sales figures were a healthy 8% increase for the five month period ending July 29, 2006, this means that we are observing at least a short-term acceleration of sales growth. This report exceeded expectations according to the CEO Joe Pennington, and the company went ahead and raised guidance for the quarter ending August 26, 2006, to $.19 to $.20/diluted share, up from prior guidance of $.17 to $.19/share. This "trifecta" of sales reports----strong sales growth, exceeding expectations, and raising guidance, was enough to fire-up investors and get them to push the price of this stock higher.
And how about the latest quarterly result?
On June 20, 2006, CBK announced first quarter earnings results. As reported:
"Net sales in the first quarter increased 16% to $142.5 million, from $122.7 million in the prior year period, while same-store sales increased 7%. Net income for the first quarter increased 57% to $14.6 million, or $0.39 per diluted share, compared with $9.3 million, or $0.26 per diluted share, in the year ago period."
This was a very nice earnings report imho.
And longer-term results?
Looking at the Morningstar.com "5-Yr Restated" financials, we find that revenue, which was $276 million in 2002, has increased steadily to $490.5 million in 2006 and $510.4 million in the trailing twelve months (TTM).
Earnings have been a bit more erratic, climbing from $.83/share in 2002 to $1.01/share in 2004. However, they dropped to $.73/share in 2005, but have increased steadily since to $.97/share in the TTM. As an added plus, the company initiated dividends in 2004 with $.08/share paid. They have subsequently increased this to $.16/share in 2005 and since. the number of shares outstanding has been very stable with 37 million in 2002 and 37 million in the TTM.
Free cash flow appears quite healthy with $33 million in 2004, increasing to $39 million in the TTM.
CBK's balance sheet appears solid with $112.6 million in cash and $54.2 million in other current assets. The cash alone is enough to cover both the $41.5 million in current liabilities and the $33.8 million in long-term liabilities combined. Adding the cash and current assets together, gives us a sum of $166.8 million, which, when compared to the $41.5 million in current liabilities, yields a 'current ratio' of 4.02. Generally, anything 1.5 or higher is relatively 'healthy'.
How about some valuation numbers?
Reviewing the Yahoo "Key Statistics" on Christopher & Banks, we find that this is a mid-cap stock with a market capitalization of $1.10 billion. The trailing p/e is a moderate 30.02, with a forward (fye 25-Feb-08) p/e of 22.12. The PEG (5 yr expected) works out to a reasonable 1.14.
Looking at the Fidelity.com eresearch website, we can see that CBK is in the "Apparel Stores" industrial group and has a Price/Sales ratio of 2, near the top the retailers. Topping this group is Chicos Fas (CHS) with a ratio of 2.7, followed by Christopher & Banks (CBK) at 2 along with American Eagle (AEOS) at 2. Further down the list is Abercrombie & Fitch (ANF) at 1.7, Limited (LTD) at 1 and PacSun (PSUN) at 0.9.
Looking at profitability, we find Christopher & Banks at the bottom of the list of "return on equity" (ROE) with an 18.5% ROE. Topping the list is ANF at 37.6%, LTD at 31.9%, AEOS at 26.4%, CHS at 26% and PSUN at 23.1%. Thus, from these parameters, the company is relatively richly priced and is relatively less profitable than some of these other retailers.
Returning to Yahoo for some additional numbers, we see that there are 37.41 million shares outstanding and 36.41 million that float. Currently (as of 7/11/06) there are 2.54 million shares out short, representing 7% of the float or 4.4 trading days of average volume (the short ratio). This looks a little significant based on my own 3 day short interest 'rule'.
The company, as noted, pays a small $.16/share dividend yielding 0.60%. The last stock split, also as reported above, was August 28, 2003, when a 3:2 split was declared.
And what does the chart look like?
If we review a "Point & Figure" chart on CBK from StockCharts.com:
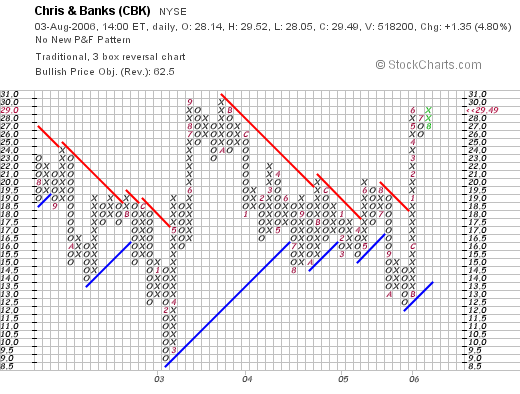
We can see that the stock has been trading sideways for the greater part of the past four years. Recently, the stock has moved back to historic highs and is poised to move into higher territory, as long as the underlying market allows. The graph is relatively neutral imho, and certainly doesn't look way over-priced.
So what do I think? Reviewing some of the above points on CBK, the company reported strong same store sales today in the low double-digit range and raised guidance for the current quarter. The latest quarterly results were solid with growing revenue and earnings. Morningstar.com looks strong as well except for a dip in earnings a few years ago, the company is free cash flow positive and has a nice balance sheet with lots of cash. Valuation wise, the p/e is a tad rich but the PEG is just over 1.1. The Price/Sales figures are a bit rich for the group and the profitability as measured by ROE is a tad low ...not my favorite combination of measurements. Finally, the graph is neutral and more recently appears to be moving higher.
In summary, I like the sales and earnings momentum on this company. Especially the same-store sales results. The other numbers are also supportive. While there is a premium being paid as indicated by the relatively rich price/sales ratio, the latest numbers certainly suggest the premium is well worth it!
Thanks so much for stopping by and visiting. If you have any comments or questions, please feel free to leave them on the blog or email me at bobsadviceforstocks@lycos.com. Please also visit my Stock Picks Bob's Advice podcast site where I also talk about , in addition to writing about, my various stock market ideas!
Bob
Posted by bobsadviceforstocks at 1:10 PM CDT
|
Post Comment |
Permalink
Updated: Thursday, 3 August 2006 11:18 PM CDT
Newer | Latest | Older


