Stock Picks Bob's Advice
Sunday, 5 February 2006
Secure Computing (SCUR) A Reader Writes "...can you help me take a look at SCUR?"
Hello Friends! Thanks so much for stopping by and visiting my blog,
Stock Picks Bob's Advice. As always, please remember that I am an amateur investor, so please remember to consult with your professional investment advisors prior to making any investment decisions based on information on this website.

I had a nice comment from a Xanga fan, JaQo, who wrote
"...can you help me take a look at SCUR.. let me know what you think.. thanks
First of all, thanks so much for commenting on the blog. Please remember that I cannot tell whether a stock will be rising or falling (!), but can tell you how it fits into my perspective, my strategy here on Stock Picks.

Ironically, it is interesting that you ask about Secure Computing (SCUR). You may not realize this, but I
did review Secure Computing (SCUR) on Stock Picks Bob's Advice on December 30, 2003, a little over two years ago (!) when it was trading at $16.78. SCUR closed on 2/3/06 at $13.29, down $(3.49) or (20.8)% since posting. It has not bee a superstar on my blog :(. By the way, I do not own any shares nor do I have any options on this company.
Let's take another look at the company and see what we find.
First of all, according to the
Yahoo "Profile" on Secure Computing, the company
"...develops network security solutions that enable organizations to exchange critical information with their customers, partners, and employees. Its product lines include Sidewinder G2 security appliances for application security; SafeWord products that enable organizations to remote access to network resources and verify the identity of remote users; Web filtering products to monitor the Internet use with control over outbound Web access; and embedded firewall, which offers a security solution to manage access control inside the corporate perimeter firewall."
And what about the latest quarterly results? On February 2, 2006, SCUR
reported 4th quarter 2005 results. Revenue for the quarter came in at $30.2 million, an 18% increase over the $25.5 million in revenue the prior year and a sequential increase of 11% over the $27.2 million in the previous quarter. Net income for the quarter came in at $6.6 million, or $.17/diluted share, up strongly from the $4.5 million or $.12/diluted share in the year ago same quarter. This certainly was a strong quarter.
However, the company is apparently merging with CyberGuard, which seems to be having some dilutive effects on upcoming earnings results. I suspect that this portion of the earnings report is what is keeping a "damper" on the market response for the stock. Within this report is the first quarter 2006 guidance, where revenues are indeed expected to climb sharply to $45 million. However, fully diluted GAAP eanings/share are expected to be only $.01/share, assuming a fully-diluted 60 million shares (up from about 36 million currently). Even "Non-GAAP" fully diluted pro forma eps works out to be $.13/share, which would also be down from the current quarter just reported. It may, imho, take a couple of quarters for this company to get back on track in regards to earnings.
How about longer-term results? Looking at the
"5-Yr Restated" financials from Morningstar.com, we can see a very pretty picture of steady revenue growth from $34.6 million in 2000 to $93.4 million in 2004 and $104.5 million in the trailing twelve months (TTM).
Earnings have also been increasing from a loss of $(.76)/share in 2000 to $.34/share in 2004, and $.52/share in the TTM.
Free cash flow has also been improving from $(1) million in 2002 to $12 million in 2004 and $21 million in the TTM.
The balance sheet as reported on Morningstar.com looks very nice with $72.6 million in cash and $35.7 million in other current assets, giving the company a current ratio of almost 3.0, given the current liabilities of only $35.2 million. Long-term liabilities stand at a small $8.7 million.
However, all of this appears to be changing to the significant acquisition of CyberGuard.What about some numbers on this stock? Looking at the numbers from
Yahoo "Key Statistics" on Secure Computing, we find that the market cap is a small-cap level $490.84 million. The trailing p/e is 25.61, and the forward p/e (fye 31-Dec-06) is a bit nicer at 20.77. (I am not sure this accounts for the latest guidance of $.01/share for the next quarter.) The PEG is also reasonable at 1.38.
There are 36.93 million shares outstanding and 34.24 million of them that float. Currently, there are 3.94 million shares out short, representing 10.9% of the float as of 1/10/06. This works out to 10.7 trading days of volume. This by itself is bullish for the stock as a lot of shares need to be repurchased for the shorts to cover. But it will require another dose of good news to squeeze the shorts into buying.
No cash dividend and no stock splits are reported.
Finally, let's take a look at a chart on SCUR. Looking at the
"Point & Figure" chart on SCUR from Stockcharts.com, we can see that the stock was moving ahead nicely between July, 2002, when the stock was as low as $2.50 to January, 2004, when the stock hit $19.50.
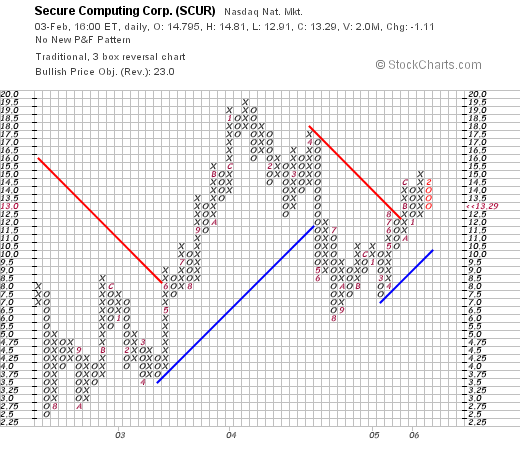
However, shortly after that, the stock broke through support at $13.00 to drop as low as $6.00 before once again heading higher. The stock is mildly encouraging short and long-term.
So what do I think? Well, I was a big fan of this stock back in 2003. Unfortunately, the stock never went anywhere and is currently selling at a price under what I posted it. The numbers from the latest quarter are quite strong. The Morningstar.com page looks nice. Valuation is reasonable. It is just the large acquisition of CyberGuard that appears to be having some dilutive effects on earnings short-term. At least from the estimates on earnings results. After that, if things go well, the stock may well head higher once again.
Good-luck on SCUR. Let me know what you decide to do. I am a bit bothered by the guidance for the next quarter and wouldn't be buying it myself, even though I did post it a couple of years ago.
If you have any other comments or questions, please feel free to leave them on the blog or email me at bobsadviceforstocks@lycos.com.
Bob
"Looking Back One Year" A review of stock picks from the week of November 15, 2004

Hello Friends! Thanks so much for stopping by and visiting my blog,
Stock Picks Bob's Advice. As always, please remember that I am an amateur investor, so please remember to consult with your professional investment advisors prior to making any investment decisions based on information on this website.
I made two stock picks on the week of November 15, 2004. For the sake of review, let's look at those picks and see how the stocks performed subsequently. However, please note, that I recomment and utilize a strict strategy of selling losing stocks quickly and completely at an 8% loss, and selling winning stocks partially and slowly at selected appreciation points.

On November 17, 2004, I
posted Watts Industries (WTS) on Stock Picks Bob's Advice when it was trading at $29.90. WTS closed at $31.39 on 2/3/06, for a gain of $1.49 since poting or 5.0%.

On October 31, 2005, Watts (WTS)
announced 3rd quarter 2005 results. Sales for the quarter ended October 2, 2005, came in at $232.7 million, an increase of 11% from the same quarter last year. Earnings, however, declined to $13.4 million or $.40/share, down from $13.7 million or $.42/share the prior year.

On November 18, 2004, I
posted Genesco (GCO) on Stock Picks Bob's Advice when it was trading at $28.35/share. GCO closed at $38.22 on 2/3/06, for a gain of $9.87 or 35% since posting.

On November 22, 2005, GCO
reported 3rd quarter 2006 results. Net sales for the quarter ended October 29, 2005, increased 10% to $316 million, up from $288 million in the same quarter last year. Earnings increased to $16.2 million or $.62/diluted share, up from $12.4 million or $.49/diluted share the prior year same period. In addition the company raised fiscal 2006 guidance--all-in-all a very nice report.
So how did we do with these two stocks from that week a little over a year ago on Stock Picks? One stock increased 5% and the other stock appreciated 35%, for an average appreciation of 20% for the two stocks that week.
Thanks again for stopping by and visiting. Please remember that I am an amateur investor, and that past performance is not a guarantee of future performance. If you have any comments or questions, please feel free to email me at bobsadviceforstocks@lycos.com.
Bob
Friday, 3 February 2006
Aviall (AVL) "Revisiting a Stock Pick"
Hello Friends! Thanks so much for stopping by and visiting my blog,
Stock Picks Bob's Advice. As always please remember that I am an amateur investor, so please remember to consult with your professional investment advisors prior to making any investment decisions based on information on this website.

I was scanning the
list of top % gainers on the NYSE today, and came across an old favorite of mine, Aviall (AVL) which as I write is trading at $35.28, up $1.28 or 3.76% on the day. I do not own any shares of this stock nor do I own any options.
I first
posted Aviall (AVL) on Stock Picks Bob's Advice on September 7, 2004, when the stock was trading at $21.30. With the stock currently trading at $35.28, this represents a gain of $13.95 or 65.5% since posting the stock here.
Let's take a closer look at this company. First of all, according to the
Yahoo "Profile" on Aviall, the company
"...through its subsidiaries, Aviall Services, Inc. (ASI), and Inventory Locator Service, LLC, (ILS) provides aftermarket supply-chain management services for the aerospace, defense, and marine industries worldwide. ASI purchases various new aviation parts, components, and supplies from original equipment manufacturers and resells them to government, military, general aviation, corporate, and commercial airline customers. It offers aviation batteries, hoses, wheels and brakes, oxygen, and paint services. ASI also provides services, such as repair and assembly, supply-chain management, and information-gathering and delivery."

And how about the latest quarterly report? On January 31, 2006,
Aviall (AVL) reported 4th quarter 2005 results. Sales climbed 28% to $347.9 million from $271.7 million in the same quarter last year. Net income grow to $13.9 million or $.40/share, up from $9.7 million or $.30/share in the same quarter last year.
And longer-term? Looking at the
Morningstar.com "5-Yr Restated" financials, we can see a steady growth in revenue from $486 million in 2000 to $1.16 billion in 2004 and $1.21 billion in the trailing twelve months (TTM). Earnings have been a bit erratic with $.14/share in 2001, dropping to a loss of $(.29)/share in 2003, then increasing to $1.28 in 2004 and $1.50 in the TTM. Shares outstanding have grown significantly from 19 million in 2001 to 34 million in the TTM.
Free cash flow has 'bounced around' a little with $(44) million in 2002, increasing to $70 million in 2004 and $22 million in the TTM.
The balance sheet as presented by Morningstar.com looks solid with $6.0 million in cash and $555.8 million in other current assets, enough to cover the $243 million in current liabilities more than 2x over. The current assets can cover the current liabilities and the $207.2 million in long-term liabilities combined.
And what about some valuation numbers on this stock? Looking at
Yahoo "Key Statistics" on Aviall (AVL), we find that the stock is a mid-cap stock with a market capitalization of $1.2 billion. The trailing p/e is moderate at 23.38. The forward p/e (fye 31-Dec-06) is even nicer at 18.75. The PEG (5 yr expected) works out to 1.57. PEG's 1.5 or lower are attractive for investment.
Aviall is part of the "Aerospace/Defense-Products/Services" industrial group according to the
Fidelity.com eResearch website. Within this group, AVL is reasonably priced in terms of the Price/Sales ratio. Topping this group is Rockwell Collins with a Price/Sales ratio of 2.4. Aviall, DRS Technologies, and EDO all come in with a ratio of 1.0. This is followed by Alliant Techsystems at 0.9, and Orbital Sciences at 0.8.
Going back to Yahoo, we find that there are 34.08 million shares outstanding ant as of January 10, 2005, there were 2.99 million shares out short representing 7.3 trading days of volume. With the great earnings and upward move to the stock, I wouldn't be surprised to learn that some of the buying pressure is from shorts who are scrambline to limit their losses as the stock climbs in price. No cash dividend and no stock dividends are recorded on Yahoo.
What about the chart? Looking at the
"Point & Figure" chart on Aviall from Stockcharts.com:
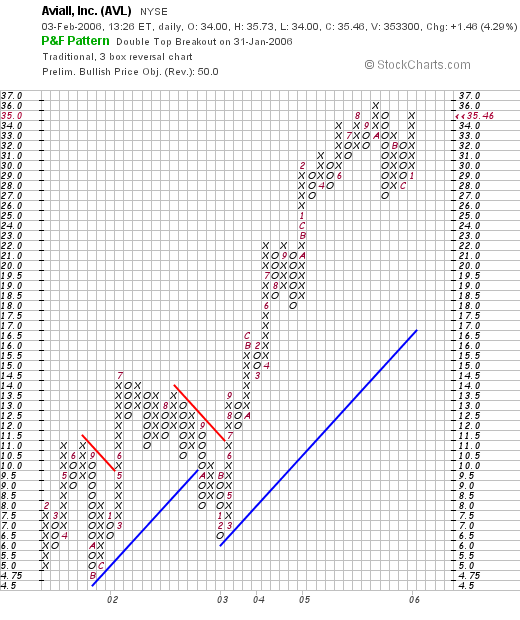
We can see a very pretty picture with the stock climbing strongly from February, 2001, when the stock was trading at $8.000 down to a level of $4.75 in August, 2001. The stock later climbed higher but broke down once again in September, 2002. By June, 2003, the stock had broken through resistance at $11 and has not looked back yet.
So what do I think? Well the stock is moving higher nicely today in an otherwise weak market, the latest quarterly report was quite strong, the history of revenue growth has been solid, with earnings a little less consistent but increasing nicely the past few years. Free cash is positive and the balance sheet looks strong. Valuation is reasonable and the chart looks strong.
Anyhow, I don't have any money to be buying any stock today, but if I were, this is the kind of company that I have looked at in the past and desereves your attention today. If you have any comments or questions, please feel free to leave them on the blog or email me at bobsadviceforstocks@lycos.com.
Bob
Thursday, 2 February 2006
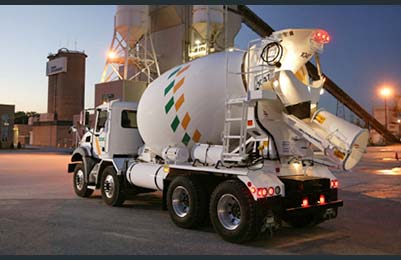
Oshkosh Truck (OSK) "Revisiting a Stock Pick"
Hello Friends! Thanks so much for stopping by and visiting my blog,
Stock Picks Bob's Advice. As always, please remember that I am an amateur investor, so please remember to consult with your professional investment advisors prior to making any investment decisions based on information on this website.
Click HERE for my ***PODCAST*** on Oshkosh Truck
The market is doing poorly today with the Dow down 104 points to 10,849.25, and the NASDAQ off 27.52 to 2,283.04 as I write. But that doesn't mean we can't find stocks that fit our criteria and are bucking the trend!
In fact, looking through the
list of top % gainers on the NYSE today, I came across an old favorite of mine, Oshkosh Truck (OSK) which is currently trading at $53.06, up $4.36 or 8.95% on the day as I write. I do not personally own any shares or options on this stock but my stock club does own some shares on Oshkosh which has been a terrific performer for my investment club.
I first
posted Oshkosh Truck (OSK) on Stock Picks Bob's Advice on June 12, 2003, when the stock was trading at $62.50. The stock split 2:1 on August 14, 2003, and again another 2:1 split on August 29, 2005, so my cost-basis for my pick is actually $62.50 x 1/2 x 1/2 = $15.63. Thus, my pick has appreciated $37.43 or 239.5% since posting. And honestly, I did not buy any shares of this stock for myself!

According to the
Yahoo "Profile" on Oshkosh Truck, the company
"...engages in the design, manufacture, and marketing of various specialty commercial, fire and emergency, and military trucks; truck bodies; mobile and stationary compactors, and transfer stations; and portable and stationary concrete batch plants worldwide."
What drove the stock higher today, as is often the case with large stock gains, was the
announcement of 1st quarter 2006 results prior to the start of trading. They reported a 22.5% increase in sales to $790.3 million, over last year's sales figure of $644.9 million. Net income increased to $53.1 million or $.72/share, up 28.6% from net income of $40.6 million or $.56/share last year. This exceeded earnings estimates of $.50-$.55/share given by Oshkosh previously. As I like to say, a "trifecta" in investing is an announcement of earnings with increases in both revenue and earnings along with increased guidance. In line with this Oshkosh increased its earnings per share guidance for 2006 to $2.55-$2.65/share. Just to top off this great report, the company went ahead and raised its dividend by 48%. What else could an investor want?
How about longer-term results? Looking at the
Morningstar.com "5-Yr Restated" financials, we can see the steady growth in revenue from $1.4 billion in 2001 to $3.0 billion in 2005. Earnings/share have also not 'missed a beat' increasing from $.75/share in 2001 to $2.18 in 2005. In addition the company has been paying dividends during this time increasing from $.09/share in 2001 to $.22/share in 2005.
Free cash flow has been positive and growing, increasing from $81 million in 2003, $105 million in 2004 and $169 million in 2005.
The balance sheet is adequate with $127.5 million in cash and $826.9 million in other current assets. That is enough to cover both the $775.5 million in current liabilities and the $124.1 million in long-term liabilities combined.
And how about valuation?

Looking at
Yahoo "Key Statistics" on OSK, we find that OSK has now grown into a large cap stock with a market capitalization of $3.92 billion. The trailing p/e isn't too bad at 24.54 and the forward p/e (fye 30-Sep-07) is estimated at an even nicer 17.51. Pertinently, the PEG ratio (5 yr expected) is very nice at under 1.0, recorded at 0.89.
Even though the Price/Sales ratio of Oshkosh Truck is only 1.2, this still puts it at the top of its industrial group of "Trucks & Other Vehicles" according to the
Fidelity.com eResearch website. Oshkosh is followed by Paccar at 0.9, AB Volvo at 0.6, Accuride at 0.5 and Navistar at 0.2. So while not priced absolutely richly by this parameter, the company is still the priciest by this ratio among its peers.
Going back to Yahoo for some other numbers, we can see that there are 73.49 million shares outstanding. Of these, 1.28 million are out short as of 1/10/06, representing 1.80% of the float. This is also 4.9 trading days of volume. Since this exceeds my own 3 day rule of significance, in light of the good news and the price rise today, this is certainly a bullish factor on this stock and may well be adding to the buying pressure in Oshkosh in the face of an overall weak market.
As I noted above, the company does pay a dividend (which has just been increased 48%), and up to today, the company has been paying a $.25/share dividend yielding 0.50%. As I also noted above, the company last split its stock 8/29/05 with a 2:1 split.
What about the chart? Taking a look at the
"Point & Figure" chart on Oshkosh (OSK) from Stockcharts.com:
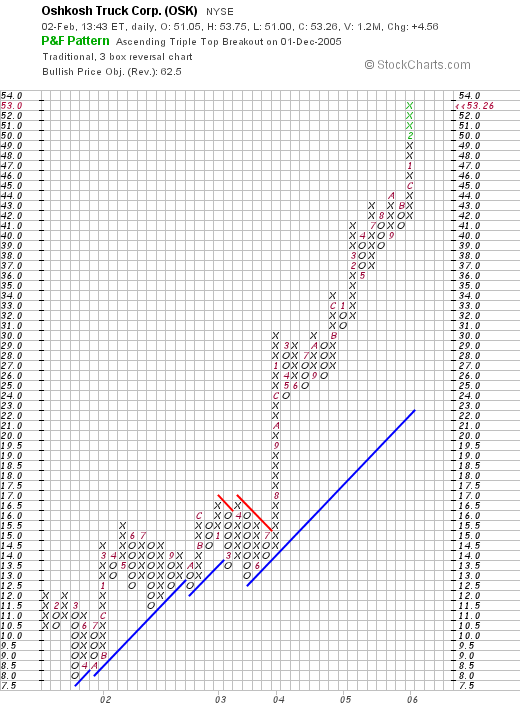
This chart is probably the strongest chart that is posted on the entire website here! The stock declined from $12.00 in January, 2001, to a low of $8.00 in March, 2001. Since then the stock price has climbed almost perfectly higher to its current level of $53.26 (as I write). If anything, the chart appears to be over-extended, by which I mean the climb has been almost straight up, and the price might well come down a bit to consolidate....but then again, I wouldn't want to be selling short on this stock today!
Anyhow, this is a very pretty picture of a stock. The earnings announcement was strong, they exceeded expectations, raised guidance, and increased their dividend! The past five years have been equally steady in growth in both revenue and earnings. Free cash flow is positive and steadily growing and the balance sheet is solid. Valuation-wise, this stock sports a p/e in the low 20's, the PEG is under 1.0, and the price/sales ratio, while top in its group, isn't that high either in absolute terms. On top of this the chart is unbeatable. The only thing I could think of which would be nicer, would be me telling you how smart I was and how I bought loads of shares when I first wrote up this stock. I did present OSK to my stock club, but otherwise, I didn't buy any shares :(.
Thanks again for stopping by! If you have any questions or comments, please feel free to leave them on the blog or email me at bobsadviceforstocks@lycos.com.
Bob
Posted by bobsadviceforstocks at 1:40 PM CST
|
Post Comment |
Permalink
Updated: Sunday, 5 February 2006 11:40 AM CST
Relm Wireless (RWC) A Reader Writes "...I'm curious to hear your thoughts on this stock."
Hello Friends! Thanks so much for stopping by and visiting my blog,
Stock Picks Bob's Advice. As always, please remember that I am an amateur investor, so please remember to consult with your professional investment advisors prior to making any investment decisions based on information on this website.
I very much enjoy receiving comments and questions for readers. When a reader asks me about a particular stock that they have found, I must assume that they have purchased shares in that stock, so please be aware of that possibility. On the other hand, I also sometimes write about stocks that I own, so always take that into consideration whenever I write about stocks!
I received a nice letter last night from a reader that I would like to share with you and comment on. If you have questions or comments, please feel free to leave them on the blog or email me at bobsadviceforstocks@lycos.com. Please give me a name and a location and if you do own some shares of the stock, please let me know so that our readers can also take that into consideration. Unfortunately, I cannot answer or comment on all of the email and comments I receive, but I shall try to get to as many of these as possible.
In any case, this is the letter I received:
Bob,
I really love reading your site and have learned a lot in doing so. In doing some personal stock research I came upon RWC (Relm Wireless) and I'm curious to hear your thoughts on the stock. I understand it may not be a perfect macth for you, or that you may not be on the market for a new stock. Nonetheless, looking forward to hearing your thoughts.
Thanks,
Maryanne
Maryanne, thank you for your kind words. I cannot predict what any particular stock will do, but I can tell you if it sort of fits into our strategy on this website. I hope my discussion is helpful to you in this regard.

Let's take a closer look at Relm (RWC) and see what we can find. I do not own any shares of this stock and do not have any options. In fact, I have never even heard of this company until Maryanne wrote me a letter about it last night.
First of all as I write this morning, RWC is trading at $10.25, down $(.2501) or (2.38)% on the day.
And what does this company do? According to the
Yahoo "Profile" on Relm, the company
"...engages in the design, manufacture, and marketing of wireless communications products primarily in the United States. Its products include two-way radios, repeaters, base stations, and related components and subsystems, which are sold under the brands BK Radio, RELM, and Uniden. The company sells its products in the government and public safety market, and the business and industrial market."
And the latest quarterly result? On November 1, 2005, the company
announced 3rd quarter 2005 results. Sales grew 46.6% to $7.6 million from $5.2 million in the year-ago same period. Net income came in at $1.2 million or $.09/diluted share, up from $.5 million or $.04/diluted share the prior year same period. So far so good!
How about longer-term? Looking at a longer-term picture with the
Morningstar.com "10-Yr Income" statement on RWC , we actually see a
dismal picture of declining revenue from $68.7 million in 1996 down to a low of $16.0 million in 2002. However, since that time, revenue has been increasing steadily to $20.7 million in 2004 and $25.1 million in the trailing twelve months (TTM).
If we look at our usual
"5-Yr Restated" financials on RWC from Morningstar.com, things don't look quite as gloomy at all. The company, at least short-term, does appear to be turning around. Revenue
did drop from $22.8 million in 2001 to $16.0 million in 2002 as we noted, but then increased to $19.7 million in 2003, $20.7 million in 2004 and $25.1 million in the TTM. Time will tell if the company can regain its previous revenue picture.
Similarly, earnings did drop from a loss of $(.27)/share in 2000 to a low of $(.47)/share in 2002, but have been improving since then to $.09/share in 2003, $.65/share in 2004 and $.69/share in the TTM.
Free cash flow has been nil, but at least not negative with $1 million in free cash flow in 2002, increasing to $2 million in 2004, but back to -0- in the TTM.
The balance sheet is solid with $2.4 million in cash reported by Morningstar.com balanced against $1.8 million in current liabilities and $0 in long-term liabilities. In addition, Morningstar reports the company with $12.4 million in other current assets.
How about valuation? Looking at
Yahoo "Key Statistics" on Relm, we can see that this is a very small company with a market capitalization of only $134.4 million. The trailing p/e isn't bad at 15.99, but the forward p/e comes in at 19.34--leading me to suspect that this figure hasn't been updated on Yahoo due to the small size of the company and probably the infrequent analysts estimates. Sometimes companies this size don't even have analysts following their progress! Even so, the PEG comes in at 0.98, making this a good value based on growth and earnings performance.
According to the
Fidelity.com eResearch website, this company is in the "Electronic Equipment" Industrial Group. The company, even though the PEG is nice, has a Price/Sales ratio of 5.6, which is at the top in terms of valuation of this group from this perspective. Other stocks in the group include DTS with a Price/Sales ratio of 4.2, Avid at 2.7, Harman International at 2.4, EchoStar at 1.6, and Sony at 0.7.
Going back to Yahoo we can see that there are only 13.11 million shares outstanding with 290,740 shares out short, representing only 2.5% of the float or 1 trading day of volume. This doesn't appear to be a factor. Yahoo reports no cash dividends and the last stock split was actually a reverse 1:6 stock split 6/17/91.
What about the chart? Taking a look at the
"Point & Figure" chart on RWC from Stockcharts.com:
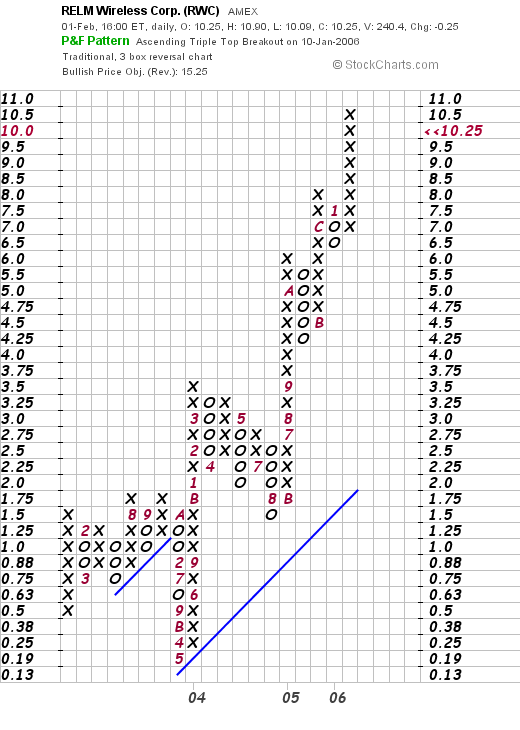
We can see that the stock was trading lower between January, 2003, when it was at $1.50, down to a low of $.19/share in May, 2003. The stock has moved strongly higher since to the current $10.25 level.
So what do I think? Well, it is a bit speculative for my taste :). Although I have purchased similar speculative stocks. I do like the latest quarterly report, the Morningstar.com report is also adequate. However, the steady drop in revenue the past 10 years is of some concern to me but it appears that the company is on the right track. Valuation-wise the p/e and the PEG are nice and the Price/Sales ratio is a bit rich. The chart is strong, the balance sheet is excellent, and the free cash flow is nil.
Could this be a winner for you? Perhaps. If it were on the top % gainers list, and I had some money to be buying some shares, I would be looking at a stock like this :). Good-luck and let me know how you do with this and if you did purchase some shares.
Bob
Wednesday, 1 February 2006
"Revisiting a Stock Pick" Armor Holdings (AH)
Hello Friends! Thanks so much for stopping by and visiting my blog,
Stock Picks Bob's Advice. As always, please remember that I am an amateur investor, so please remember to consult with your professional investment advisors prior to making any investment decisions based on information on this website.

Looking through the
list of top % gainers on the NYSE today, I came across Armor Holdings (AH) which closed at $50.75, up $3.08 or 6.46% on the day. I do not own any shares of AH nor do I have any options on this stock.

AH is an old selection of mine have
picked Armor Holdings (AH) for Stock Picks Bob's Advice on December 8, 2003, a little over two years ago, when the stock was trading at $26.35/share. Thus, the stock has appreciated $24.40 or 92.6% since posting.
Let's take another look at this stock and see how it fits into the strategy on this website.
First of all, let's review what the company does. According to the
Yahoo "Profile" on Armor Holdings, the company
"...engages in the manufacture and distribution of security products and vehicle armor systems for the law enforcement, military, homeland security, and commercial markets. It operates in three divisions: Aerospace and Defense Group, Products, and Mobile Security."
As is often the case, what drove the stock higher today, was the
announcement of 4th quarter 2005 earnings after the close of trading yesterday. Revenue for the quarter totaled $452.7 million, up 34% from $337.5 million the prior year. This also topped the mean estimate of $447.9 million. Income for the quarter rose to $37.6 million or $1.04/share, up from 426.4 million or $.74/share the prior year same quarter. As I like to suggest, an earnings report is a perfect "trifecta" if the company also raises guidance during the quarter. As the report noted:
"Armor forecast first-quarter income of $1.05 to $1.10 per share, including a penny of integration costs. The company raised its annual forecast to a range of $4.10 to $4.30 per share on revenue of $1.71 billion to $1.77 billion, up sharply from a prior estimate for income of $3.55 per share and $1.6 billion in revenue.
Analysts currently predict quarterly earnings of 96 cents per share on $428 million in revenue, and yearly income of $3.74 per share on $1.66 billion in revenue."

How about longer-term? Looking at the
Morningstar.com "5-Yr Restated" financials on AH, we can see the steady growth in revenue from $140 million in 2000, to $980 million in 2004 and $1.5 billion in the trailing twelve months (TTM).
Earnings have been less consistant dropping from $.73/share in 2000 to a loss of $(.57)/share in 2002, only to start rapidly increasing to $.38/share in 2003, $2.44/share in 2004, and $3.38 in the TTM. Free cash flow has also been a bit inconsistent increasing from $10 million in 2002 to $42 million in 2003, dropping to a negative $(5) million in 2004 and back to $31 million in the TTM.
The balance sheet looks fine to me with cash of $426.9 million and other current assets of $480 million and only $542.6 million in current liabilites giving the stock a current ratio of almost 2:1. In addition, the company has $198.0 million in long-term liabilities.
And what about some valuation statistics on this stock? Looking at
Yahoo "Key Statistics" on AH, we find that this company is a mid-cap stock with a market capitalization of $1.77 billion. The trailing p/e is nice at 15.13, with a forward p/e (fye 31-Dec-06) even nicer at 13.57. Thus, the PEG ratio (5 yr expected) is 1.25. Generally PEG ratios of 1.5 or lower suggest reasonable valuation for a growth stock.

Looking at the
Fidelity.com eResearch website for another parameter, the Price/Sales ratio, we find that Armor Holdings is also reasonably priced by this statistic as well. Fidelity places AH in the "Security/Protection Services" Industrial Group.
Within this group, the most "expensive" stock by Price/Sales ratios is Document Security Systems (DMC) with a Price/Sales ratio of 91.3. This is followed by Lo-Jack (LOJN) at 2.6, Checkpoint Systems (CKP) at 1.3, Armor Holdings (AH) at 1.1, and Brink's (BCO) at 0.6.
Other Yahoo statistics reveal that the company has 34.91 million shares outstanding. Of these shares there are 2.70 million out short representing 6.3 trading days of volume as of 1/10/06. This is 7.9% of the float. Thus, there are quite a few shares out short on this stock and with the strong earnings report, the price move today may represent at least in part, a certain scrambling among short sellers to buy shares to cover their shorts, pushing the stock price even higher. Just my speculation, but it is conceivable.
The company does not pay a dividend and has not split its stock per Yahoo.
And how does the chart look? Reviewing the
"Point & Figure" chart on AH from Stockcharts.com:
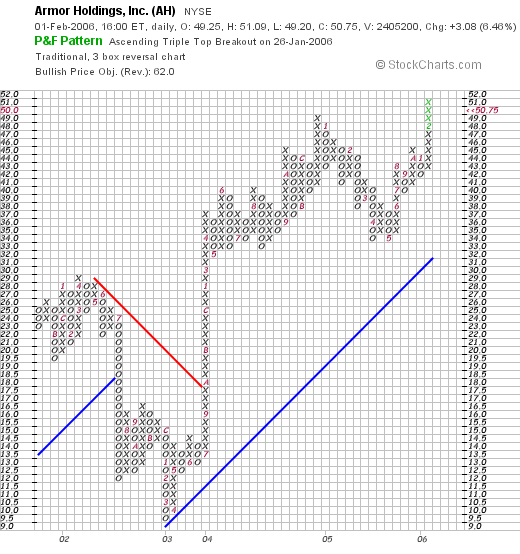
We can see how the stock actually declined from a peak of $29 in April, 2002, down to $9.50 in March, 2003, only to climb higher, breaking through resistance at $17.50 in September, 2003, to move strongly higher in price to the current level of $50.75 today. It is interesting how this corresponds to the decline in earnings into 2002 and then the turn-around in the financial fortunes of the company.
What do I think? Well, I certainly wish I had bought some shares when I first reviewed the stock! Seriously, the latest quarter was superb exceeding analysts expectations. The company raised guidance for the upcoming year. The Morningstar.com review was strong with the growth in revenue and earnings, free cash flow although fluctuating, is now positive. The balance sheet is solid, valuation is excellent and the chart is encouraging. The only thing about this stock that gives one pause is that it is a military contractor and if military requirements change, then their fortunes may also be altered. However, unfortunately, I am not so optimistic about peace breaking out in the world :(.
Anyhow, that's the stock for today! Thanks for visiting. If you have any comments or questions, please feel free to leave them on the blog or email me at bobsadviceforstocks@lycos.com.
Bob
Tuesday, 31 January 2006
New ***PODCAST*** on Church & Dwight (CHD)
Hello Friends! Thanks so much for stopping by and visiting my blog,
Stock Picks Bob's Advice. As always, please remember that I am an amateur investor so please consult with your professional investment advisors prior to making any investment decisions based on information on this website.
I wanted to let you know that I have published a new
Podcast on Church & Dwight (CHD). If you have comments or questions, you can leave them on the blog or email me at bobsadviceforstocks@lycos.com.
Bob
January 31, 2006 Church & Dwight (CHD)
Hello Friends! Thanks so much for stopping by and visiting my blog,
Stock Picks Bob's Advice. As always, please remember that I am an amateur investor, so please remember to consult with your professional investment advisors prior to making any investment decisions based on information on this website.
I was looking through the
list of top % gainers on the NYSE today and came across Church & Dwight (CHD) which closed at $36.80, up $2.19 or 6.33% on the day. I do not own any shares, nor do I have any options on this stock.
According to the
Yahoo "Profile" on Church & Dwight, the company
"...engages in the development, manufacture, and marketing of a range of household, personal care, and specialty products in the United States. The company operates in two segments, Consumer and Specialty Products. The Consumer segment includes household products for deodorizing and cleaning, such as baking soda, cat litter, and cleaning products; and laundry products, such as laundry detergents and fabric softeners. This segment also includes personal care products, such as condoms, depilatories, home pregnancy and ovulation test kits, antiperspirant, and toothpastes."
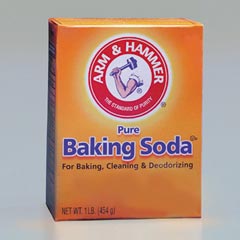
Church & Dwight is one of those classic American brands that everyone has some reference to growing up. In my case, I always remember that orange box of Arm & Hammer baking soda that my mother always kept in the refrigerator to 'keep it smelling nice.'
Looking for the latest quarterly report, I found that the company is
scheduled to announce 4th quarter 2005 results next Tuesday, February 7th. In addition, CHD was also
upgraded to "Overweight" by Lehman Brothers today, prior to the opening of trading.
CHD did report
3rd quarter 2005 results on November 8, 2005. Third quarter sales came in at $442.7 million, a 5% increase over last year's $420.3 million. Net income for the quarter ended September 30, 2005, came in at $34.6 million or $.51/share, a 21% increase from last year's net income of $27.4 million or $.42/share.
How about longer-term? Looking at the
Morningstar.com "5-Yr Restated" financials on CHD, we can see that revenue has been growing fairly steadily from $691 million in 2000 to $1.46 billion in 2004 and $1.71 billion in the trailing twelve months (TTM).
Earnings show a steady record of growth with $.56/share reported in 2000, increasing to $1.36/share in 2004 and $1.77 in the TTM.
Dividends have also been slowly if not consistently, been increasing, with $.19/share reported in 2000, $.20/share in 2002, $.21/share in 2003 and $.24/share in the TTM.
Free cash flow has been positive and growing, with $75 million reported in 2002, $86 million in 2003, $160 million in 2004 and $138 million in the TTM.
As reported by Morningstar.com, the balance sheet is adequate with $159.8 million in cash and $382.4 million in other current assets. This is balanced against $389.5 million in current liabilities and $861.7 million in long-term liabilities.
And what about "valuation"? Looking at
Yahoo "Key Statistics" on Church & Dwight (CHD0, we find that the company is a mid-cap stock with a market cpaitalization of $2.37 billion. The trailing p/e is moderate at 20.77 and the forward p/e (fye 31-Dec-06) is even nicer at 18.04. The PEG is a bit rich at 1.56 (5 yr expected.
What about the Price/Sales ratio? Looking at the
Fidelity.com eResearch website, we can see that CHD is reasonably priced in this regard relative to other companies in the "Cleaning Products" Industrial Group. Topping this group is Procter Gamble (PG) with a Price/Sales ratio of 3.4. This is followed by Ecolab (ECL) with a ratio of 2.1, Clorox (CLX) at 2.0, Church and Dwight (CHD) at 1.4, and Darling Int'l (DAR) at 1.0.

Going back to Yahoo for some additional numbers, we find that there are 64.32 million shares outstanding. As of 1/10/06, there were 1.83 million shares out short, representing 7.5 trading days of volume (the short ratio). Since I have been using 3 days as a cut-off, this indeed may be significant in predisposing this stock to a squeeze, especially if next week's earnings report is strong.
The company pays a small dividend of $.24/share yielding 0.70%. The last stock split was a 3:2 split in September, 2004.
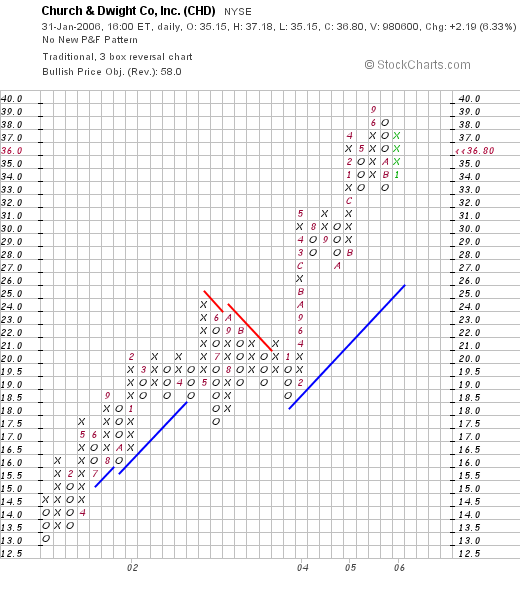
And what about a chart? If we take a look at a
"Point & Figure" chart on Church & Dwight (CHD) from Stockcharts.com, we can see what looks to be a
gorgeous chart, imho, for CHD, which going back to January, 2001, shows a fairly steady increase in stock price, except for a "pause" in appreciation in mid 2002 when the stock was trading in a range between $24 and $17.50. Otherwise the stock has been moving steadily highere, closing today in the $36.80 area, just shy of the high of $39.00.
So what do I think? Well the stock made a nice move today on an upgrade from Lehman Brothers. Earnings are scheduled for next week and there are lots of short-sellers out there who may be scrambling to buy, if the company reports a strong result and the price moves higher. All of this is bullish for the stock price.
The Morningstar.com report looks solid with steadily growing revenues and earnings. Free cash flow is positive, the balance sheet is adequate, and the P/E, PEG, and Price/Sales ratios aren't bad at all.
This is the closest thing to Peter Lynch investing that I can think of that I have posted recently. We all know their products and the stock is an attractive investment imho. Unfortunately, I don't have "permission" to be out shopping for a new company. Otherwise, this just might be the kind of stock I might be buying.
Thanks so much for stopping by! If you have any questions or comments, please feel free to leave them on the blog or email me at bobsadviceforstocks@lycos.com.
Bob
Vasco (VDSI) A Reader Writes "I have a stock I would like your opinion on."
Hello Friends! Thanks so much for stopping by and visiting my blog,
Stock Picks Bob's Advice. As always, please remember that I am an amateur investor so please remember to consult with your professional investment advisors prior to making any investment decisions.
I always enjoy receiving mail from readers of my blog and listeners of my podcasts. Please remember that I am not qualified to give you individualized advice; for that you should consult with your professional investment advisor. But when somebody suggests a stock name, I can tell you how it might fit into my own perspective, not whether it would be a good investment or not.
Sean G. was kind enough to write:
Bob,
I am a huge fan, thank you for helping a novice investor like myself.
I have learned so much in just a short time of following your
website and pod transmissions.
I have a stock I would like your opinion on. Vasco (vdsi) I feel I
have made the mistake of getting emotionally attached to it, and need
your objective rational opinion. I currently own 11,500 shares with n
average cost basis of 10.70
Thank you so much for your time,
Sean G.
First of all, thank you for your kind words. Always take what I write with a grain of salt as I am truly an amateur investor! However, it is nice to think that my writing has helped you in your understanding of the stock market. I hope that you continue to learn and share your thoughts here with our readers as well.
Let me take a lood at Vasco (VDSI) for you. Personally, I have never owned any shares and in fact have not come across this company prior to your email.
Let's take a closer look at this company. First of all the stock closed at $10.75 yesterday.
The "Profile": Per
Yahoo, the company
"...engages in the design, development, marketing, and support of open standards-based hardware and software security systems that manage and secure access to information assets worldwide. Its identity authentication products enable secure financial transactions to be made over private enterprise networks and public networks, such as the Internet."
And how was the latest quarterly result? This was a little harder to track down, but as expected, I found the latest result on the
Vasco company website. For the third quarter of 2005, revenue climbed at impressive 79% to $13.3 million from $7.4 million in 2004. Net income was $1.8 million or $.05/diluted share, an increase of $601,000 or 52% from the $1.2 million or $.03/diluted share in 2004. These certainly were strong results!
How about longer-term? Looking at the
Morningstar.com "5-Yr Restated" financials on VDSI, we can see that while revenue growth was flat between 2000 at $21.5 million through 2002 when it was only $17.4 million, the company then has been growing its revenue steadily to $29.9 million in 2004 and $46.4 million in the trailing twelve months (TTM).
Earnings have also been improving from a loss of $(.20)/share in 2002, they turned profitable at $.09/share in 2004 and came in at $.14/share in the TTM.
Free cash flow looks ok with $(3) million in 2002, improving to $3 million in 2004, and only $1 million in the TTM.
Balance-sheet-wise, the company looks solid with $11.7 million in cash and $11.2 million in current liabilities and only $.2 million in long-term liabilities. In addition, the company has $12.4 million in other current assets. Thus, this looks fine as well.
What about valuation? Looking at
Yahoo "Key Statistics" on VDSI, we see that the company has a market cap of only $388.24 million making it a small cap stock. The trailing p/e is quite rich at 71.87, the forward p/e is a bit better at 37.17 (fye 31-Dec-06) and the PEG is also a bit rich at 1.60.
Reviewing the
Fidelity.com eResearch website information, we can see that the company, as expected, is in the "Security Software & Services" Industrial Group. Within this group VDSI is fairly richly valued with a Price/Sales ratio of 8.7. Exceeding this is Check Point Software (CHKP) at 9.2. Other stocks in the group include McAfee (MFE) with a ratio of 4.0, RSA Security (RSAS) at 3.5, Safenet (SFNT) at 3.3, and Aladdin Knowledge System (ALDN) at 3.1. Thus, by this measure the stock also looks a bit expensive.
Going back to Yahoo for some more information, we find that the company has 36.02 million shares outstanding. Currently there are 3.23 million shares out short representing 12.40% of the float or 7.9 trading days of volume. This is bullish using my 3 day rule with a lot of shares that have been shorted that need to be covered. The "squeeze" that might result will come from a release of good earnings. Otherwise, if the earnings fall short, the stock is fairly richly valued and may be vulnerable to a correction.
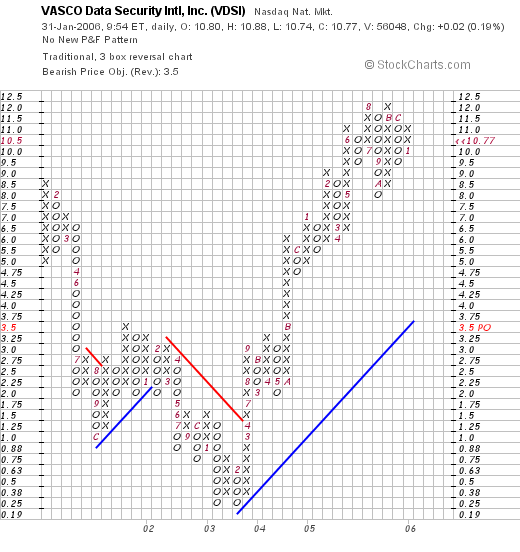
What about the chart? If we take a look at the
Vasco "Point & Figure" chart from Stockcharts.com, we can see that the stock was trading very weakly from January, 2001, when it was at the $8.50 level, down to a low of $.25/share in February, 2003. Since that time, the stock broke through resistance in April, 2003, and has been trading strongly higher to its current level of about $10.77. The chart looks strong to me as well.
So what do I think? Well, the latest quarterly report was exceptional, the Morningstar.com evaluation looks nice, and the chart looks strong. I also like the large number of shares out short on this stock.
On the downside, valuation is rich with both a steep p/e and Price/Sales ratio as well as a PEG of around 2.0. However, if the stock can come in with another superb earnings report, the short sellers may need to "eat crow". (I hope I used that slang correctly!) Time will tell I guess.
The only thing missing from my perspective, is that this stock wasn't on the top % gainers list and I didn't sell any stock at a gain, otherwise with the stock over $10, I might be tempted to buy as well.
Will this stock turn out to be a good investment for you? I hope so for your benefit. If I were owning shares, I still would hold to my 8% loss limit and also keep to my targeted sales at gains. Good luck and let me know how it all turns out. In any case, please remember that I am an amateur investor, so please consult with professionals. Anytime you invest in small cap stocks like this, there is always increased risk, as well as increased potential for the individual investor.
I cannot answer all of the email that I receive, but if you have a comment or question, please feel free to leave them on the blog or email me at bobsadviceforstocks@lycos.com.
Bob
Monday, 30 January 2006
January 30, 2006 FMC Technologies (FTI)
Hello Friends! Thanks so much for stopping by and visiting my blog,
Stock Picks Bob's Advice. As always, please remember that I am an amateur investor, so please remember to consult with your professional investment advisors prior to making any investment decisions based on information on this website.

Earlier today, my position in Jos. A Bank (JOSB) hit a sale point and I sold 1/6th of my position at a 60% gain target. This entitled me to purchase a new position as I am under my 25 position maximum. Looking
today through the
list of top % gainers on the NYSE, I came across FMC Technologies (FTI) which closed at $51.30, up $2.47 or 5.06% on the day. Before the close, I purchased 160 shares at $52.30 of FTI.
Let's take a closer look at this stock and see how it fits into my strategy on this blog.
According to the
Yahoo "Profile" on FMC, the company
"...engages in the design, manufacture, and servicing of machinery and systems for the energy, food processing, and air transportation industries. It operates in four segments: Energy Production Systems (EPD), Energy Processing Systems (EPS), FoodTech, and Airport Systems."
What drove the stock higher today was an
announcement about 4th quarter profits that was released by the company prior to trading. The company basically announced that it was raising guidance on the fourth quarter. The street liked what it 'heard' and the stock took off in price! My purchase was actually mid-day and as the market moved into the afternoon, both the overall stock averages as well as FTI stock pulled back by the time of the close to $1 under my own purchase price.
And how did the company do in the latest announced quarter? On November 1, 2005, FTI
announced 3rd quarter 2005 results. Revenue grew 11% to $776 million, from $700 million the prior year same quarter. Diluted earnings per share increased over 100% to $.65/share, up from $.32/share the prior year.
And what about longer-term results? Looking at the
Morningstar.com "5 Yr Restated" financials on FMC Technologies we
see that the company had $2.1 billion in revenue in 2002, $2.3 billion in 2003, $2.8 billion in 2004 and $3.1 billion in the trailing twelve months (TTM).
Earnings have improved from a loss of $(2.03) in 2002, to $1.03 in 2003, $1.68 in 2004, and $1.88 in the TTM.
Free cash flow has been positive but erratic with $51 million reported in 2002, $85 million in 2003 and $8 million in the TTM.
The balance sheet as reported on Morningstar.com appears solid with $139.6 million in cash and $1.2 billion in other current assets. This is plenty to cover both the $991.3 million in current liabilities and the $276.2 million in long-term liabilities.
How about valuation questions? Looking at
Yahoo "Key Statistics" on FMC Technologies, we find that this is a large cap stock with a market capitalization of $3.53 billion. The trailing p/e is reasonable at 27.39, with the forward p/e (fye 31-Dec-06) even nicer at 22.40. The PEG is reported at 1.99, a little rich.

Looking at the
Fidelity.com eResearch website for an assessment of relative Price/Sales valuations, we find that the company is in the "Oil & Gas Equipment/Services" industrial group. Within this group, FTI is at the bottom of the list for the Price/Sales ratio coming in at 1.1. Leading this list is Schlumberger (SLB) at 5.8, BJ Services (BJS) at 4.1, Baker Hughes (BHI) at 3.7, Cooper Cameron (CAM) at 2.4, and Halliburton (HAL) at 2.0.
Going back to Yahoo for some additional statistics, we find that there are 68.85 million shares outstanding, with 3.05 million of them out float. This represents 4.50% of the float or 4.9 trading days of volume. Thus, using my 3 day rule of significance, this is a bit of a significant short interest in this stock. No cash dividend is paid, and no stock splits are reported on Yahoo.
What about a chart? Looking at a
"Point & Figure" chart from Stockcharts.com on FTI:
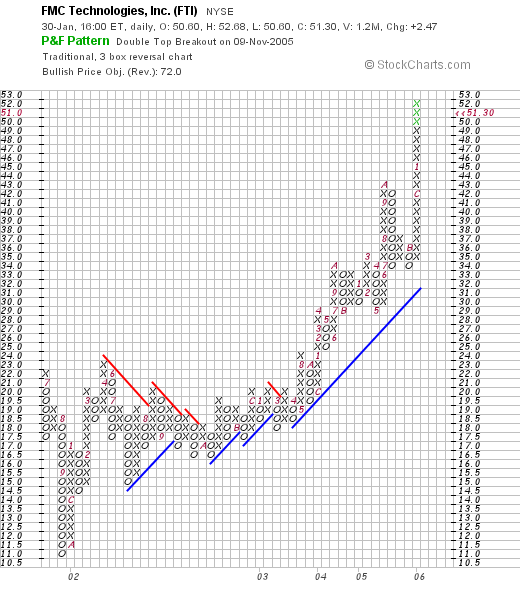
The chart shows the stock moving sideways from $W22.00 in July, 2001, to a low of $11.00 in September, 2001. The stock subsequently consolidated and then started moving higher after breaking through resistance at April, 2003, to its current price level at $51.30. The stock chart looks strong if a tad overextended at its current level.
So what do I think? Well, first of all, the company had nice news today boosting estimates for the latest quarter. The p/e isn't bad but the PEG at 2.0 isn't any bargain. The Price/Sales ratio is quite reasonable it its industrial grouping. The rest of Morningstar.com is strong with steady revenue and earnings growth, positive if not growing free cash flow, a decent balance sheet and a nice chart are other positive factors.
In fact, I liked the stock so much I bought some shares! Regards. If you have any questions or comments, please feel free to leave them on the blog or email me at bobsadviceforstocks@lycos.com.
Bob
Newer | Latest | Older


