Stock Picks Bob's Advice
Monday, 30 April 2007
How I Plan to Deal with a Market Correction
It wasn't a very good day in the market today. The Dow was down 58.03 to 13,062.91. The Nasdaq was down relatively sharper at 2,525.09, down 32.12, and the S&P was down 11.71. On a volume basis, on the NYSE there were 343 million shares advancing and 1.35 billion shares heading lower. Similarly on the NASDAQ there was 369 million shares advancing and 1.75 billion shares to the downside.
The new high/low discrepancy was also of concern with 59 new highs on the NYSE and 16 new lows, but 51 new highs and 67 new lows on the NASDAQ.
But what to do?
You all probably know my approach, but I shall be sitting tight (for now). I always reserve the right to change my mind but I shall try to follow the rules as I have developed. When stocks hit sales (like my Jones Soda) I shall unload them. Not because I think they are bad investments. Not because I think they shall not bounce back and go higher another day. Simply because in the interest of preserving my gains, I shall be limiting my exposure to declines to the rules I have set up previously.
Unfortunately I am heavily in margin.
Margin leverages everything. On the upside, gains are magnified, on the downside, the reverse is true. This is why I changed one of my plans on 25 positions. I am holding at 20 positions as my maximum until such time that either through sales or contributions, my margin has been paid off.
My portfolio management system is not about thinking. It is about observing and responding. About not anticipating, not predicting, not determining anything. Hopefully the quality stocks that I have chosen shall rebound when stocks rebound. I believe they will. I do not know when corrections last one day or one year. I don't know if anyone really knows.
Historically markets have moved higher over the long haul. And that is my place. The long haul. I shall watch my gains increase and decrease over time. I believe that with my approach, I shall be successful overall. But that is just sheer hypothesis on my part.
Meanwhile, wish me luck.
It is a cold, hard world outside. It required cold, hard decisions. And nerves of steel. With some rules and you all out there, I think this is going to go great! Time will tell.
Bob
Wm. Wrigley Jr. Company (WWY)
Hello Friends! Thanks so much for stopping by and visiting my blog, Stock Picks Bob's Advice! As always, please remember that I am an amateur investor, so please remember to consult with your professional investment advisers prior to making any investment decisions based on information on this website.
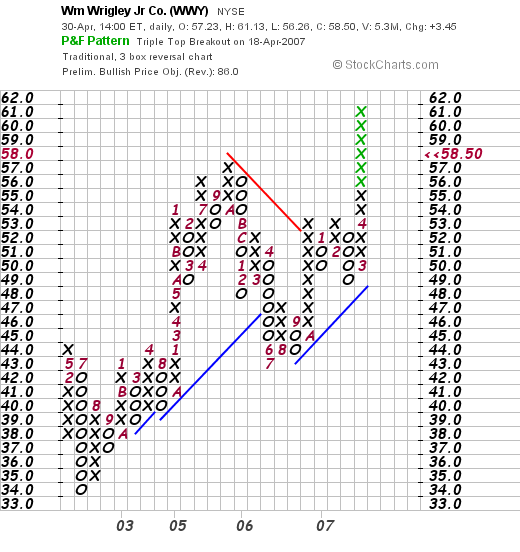
 Looking through the list of top % gainers on the NYSE this afternoon, in search of a new stock to write up here on the blog, I came across a familiar name that I haven't evaluated here but I have always thought of as a 'classical' growth stock story. William Wrigley Jr. Company (WWY), which as I write is trading at $58.99, up $3.95 or 7.18% on the day. I would like to review this stock and show you the information that I found that makes me believe this stock deserves a spot on my blog and why I believe
WM. WRIGLEY, JR. COMPANY (WWY) IS RATED A BUY
I do not own any shares of Wrigley, nor do I have any options on this stock.
What does this company do?
According to the Yahoo "Profile" on Wrigley (WWY), the company
 "...together with its subsidiaries, engages in the manufacture and marketing of chewing gums, mints, candies, and other confectionery products in the United States and internationally. The company offers its products in approximately 180 countries under Wrigley�s Spearmint, Juicy Fruit, Altoids, Doublemint, Life Savers, Big Red, Boomer, Pim Pom, Winterfresh, Extra, Freedent, Hubba Bubba, Orbit, Excel, Creme Savers, Eclipse, Airwaves, Alpine, Solano, Sugus, Cool Air, and P.K. brand names."
How did they do in the latest quarter?
As is frequently the case on stocks we find moving higher on the top % gainers list, it was the announcement of 1st quarter 2007 results this morning prior to the opening of trading that drove the stock sharply higher. Sales came in at $1.26 billion, up 17% from the same quarter the prior year. Consolidated net earnings came in at $143 million, up 28% from last year. On a diluted per share basic, this came in at $.52/share, up 30% from last year. Excluding one-time restructuring and one-time assets sale, the non-GAAP earnings still climbed 19% vs the year-ago quarter.
The company beat expectations as analysts were expecting earnings of $.47/share. They also exceeded expectations on revenue which was expected to come in at $1.18 billion.
What about longer-term results?
Reviewing the Morningstar.com "5-Yr Restated" financials on Wrigley, we can see a very steady increase in revenue from $2.7 billion in 2002 to $4.7 billion in 2006. Earnings have also increased without 'missing a beat' from $1.14/share in 2002 to $1.90/share in 2006. An added 'plus' is the fact that the company pays a dividend and has been increasing that dividend on a regular basis from $.64/share paid in 2002 to $.99/share paid in 2006. In addition, there has been a steady reduction in the outstanding shares with 353 million shares in 2002 declining to 277 million in 2006 and 276 million in the trailing twelve months.
The company is solidly cash flow positive although this hasn't been increasing recently (actually has declined) from $504 million in 2004 to $395 million in 2006.
The balance sheet is satisfactory with $254.8 million in cash and $1,226.5 million in other current assets. This total of $1,481.3 million in current assets, easily covers the $1,027.1 million in current liabilities and yields a current ratio of 1.44. (I consider current ratios of 1.25 or higher 'healthy').
What about some valuation numbers on this stock?
Checking Yahoo "Key Statistics" on Wrigley (WWY), we find that this stock is a large cap stock with a market capitalization of $16.01 billion. The company trades at a relatively rich p/e of 30.78 with a forward p/e slightly better (fye 31-Dec-08) estimated at 24.09. Even with the nice growth expected, the company does sell at a relatively rich PEG of 2.49. (I generally like PEG ratios between 1.0 and 1.5).
Examining the Fidelity.com eresearch website on Wrigley, we can see that the company is also relatively richly valued in terms of Price/Sales (TTM) coming in with a ratio of 3.26 compared to an industry average of 1.52. Fortunately, the company is slightly more profitable than the average in its industry, with a Return on Equity (TTM) of 22.50%, compared to the industry average of 20.41% per Fidelity.
Finishing up with Yahoo, we can see that there are 276.14 million shares outstanding and 218.04 million that float. Of these, 6.36 million shares were out short as of 4/10/07, representing a significant 6 days of trading volume (the short ratio) or 3.20% of the float. The possibility of a "squeeze" of the shorts is suggested by the heavy volume of shares traded today--5.35 million already, with an average volume over the past three months of 1.1 million shares/day.
As noted, the company pays a nice dividend of $1.16 (going forward) with a 2.10% yield. The last stock split was a 5:4 split April 12, 2006.
What does the chart look like?
If we examine a "Point & Figure" chart on Wrigley from StockCharts.com, we can see that the stock has moved nicely higher this past year from a $43 level in July, 2006, to the current level near $60. Overall the chart looks encouraging to me if maybe a little overextended on the current move.
Summary: What do I think?
Wrigley is a very interesting stock. I generally do not spend much time on the large cap issues because they tend to move slowly and have a harder time doubling in size! However, Wrigley came out with a very strong earnings report that exceeded expectations on both revenue and earnings. In the face of a significant short interest, the stock climbed sharply today.
More importantly, longer-term, the company has been steadily increasing revenue, earnings, and a dividend (!), with steady free cash flow and a decreasing number of shares outstanding. Their balance sheet is solid.
On a negative note, the p/e is a bit rich, the PEG is about 2.5, and the Price/Sales is higher than the average in the industry. Thus you are paying for what is generally felt to be a "quality" stock, one of the ultimate blue chips stocks out there I would say.
If you are looking for a large cap stock with something which seems to be as recession-proof as chewing gum :), then this stock might just fit the bill. Something to 'chew on' anyhow :)!
Thanks so much for stopping by and visiting! If you have any comments or questions please feel free to leave them on the blog or drop me a line at bobsadviceforstocks@lycos.com. If you get a chance, be sure and listen to my Stock Picks Podcast!
Bob
Sunday, 29 April 2007
"Looking Back One Year" A review of stock picks from the week of December 12, 2005

Hello Friends! Thanks so much for stopping by and visiting my blog, Stock Picks Bob's Advice! As always, please remember that I am an amateur investor, so please remember to consult with your professional investment advisers prior to making any investment decisions based on information on this website.
It is the weekend...at least for a few more hours! And one of the tasks that I have assigned myself here is to examine past stock selections. I am a bit more than a year out even if I say looking back one year :). In any case, last weekend I reviewed the picks from December 5, 2005. Let's take a look at the three stocks discussed on this blog during the week of December 12, 2005.
As I have mentioned before, I personally advocate and employ a very disciplined trading strategy that involves quick sales on losses of entire positions and small partial sales on targeted appreciation points. For the ease of evaluation, this review assumes a different "buy and hold" strategy. Employing a portfolio management strategy like I advocate would necessarily affect the outcome or evaluation. And not necessarily improving the performance!
In any case, let's look at those stocks from the week of December 12, 2005.
 On December 14, 2005, I posted Matrixx Initiatives (MTXX) on Stock Picks Bob's Advice when the stock was trading at $20.63. MTXX closed at $18.01 on April 27, 2007, for a loss of $(2.62) or (12.7)% since posting.
Looking at a "Point & Figure" chart on MTXX from StockCharts.com:
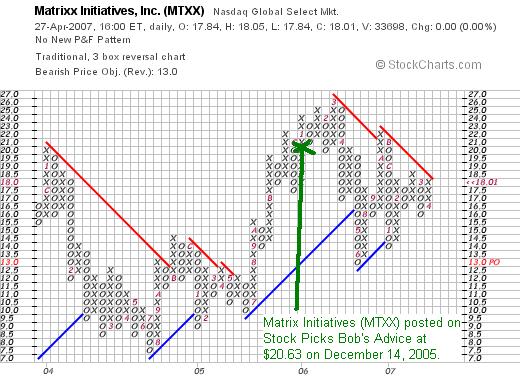
Certainly the chart is not very encouraging with the price trading below the resistance line.
Because of the chart and the earnings report,
MATRIXX INITIATIVES (MTXX) IS RATED A SELL
 On February 12, 2007, Matrixx (MTXX) announced 4th quarter 2006 results. For the quarter ended December 31, 2006, net sales declined to $36.2 million from $44.0 million in the fourth quarter of 2005. The company reported a net loss of $(463,000) during the quarter, an improvement from the $(3) million in loss in the same quarter the prior year.
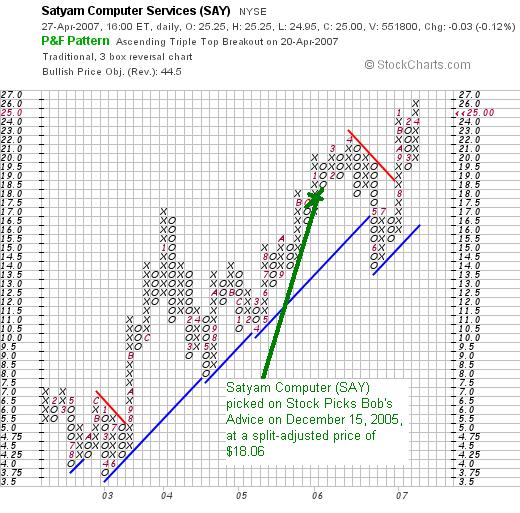
 On December 15, 2005, I picked Satyam for Stock Picks at $36.11/share. (Just two weeks ago, on April 14, 2007, I "revisited" Satyam on Stock Picks Bob's Advice when the stock was trading at $24.60 and actually purchased shares for my own portfolio!) SAY split its stock 2:1 on October 18, 2006, making my effective stock pick price actually $18.06. Thus with the close of trading on April 27, 2007, and the stock trading at $25.00, this represents a gain of $6.94 or 38.4% since posting.
 On April 20, 2007, Satyam announced 4th quarter results. During the quarter ended March 31, 2007, the company reported a profit of $86 million, up 38.6% from last year. Revenue totaled $411 million, up 36.7% from last year's results.
SATYAM COMPUTER (SAY) IS RATED A BUY
If we examine the "Point & Figure" chart on Satyam from StockCharts.com, we can see how strongly the stock has been trading as it continuess to stay on the upside of the support line after hitting some short-term weakness from April, 2006, to July, 2006, last year.

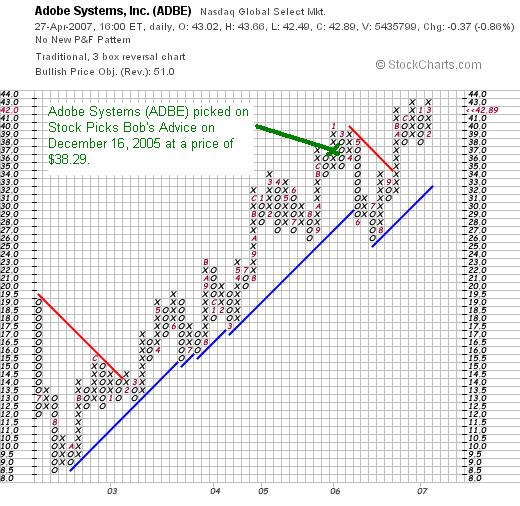
On December 16, 2005, I posted Adobe (ADBE) on Stock Picks Bob's Advice when it was trading at $38.29. ADBE closed at $42.89 on April 27, 2007, for a gain of $4.60 or 12.0% since posting.
On March 20, 2007, Adobe Systems (ADBE) announced 1st quarter 2007 results. Revenue came in at $649.4 million, down slightly from $655.5 million in the same quarter the prior year. GAAP operating income did increase to $146.3 million in the quarter up from $130.0 million in the same quarter in 2006. Diluted earnings per share were $.24 vs. $.17/share in the first quarter of 2006.
The company slightly beat estimates on earnings but missed on revenue in this report.
From my perspective, the failure to achieve revenue growth, while still managing to post improvement in earnings leaves me with this assessment:
ADOBE SYSTEMS (ADBE) IS RATED A HOLD
If we look at the StockCharts.com "Point & Figure" graph on Adobe Systems we can see a very pretty picture suggesting continued strength in this stock. Technically, from my amateur perspective, the chart looks very strong.
So how did I do during that week back in December, 2005, picking stocks? Well really not that bad. I had two gainers and one decliner. The average performance was a gain of 12.6% since posting them on the blog.
Thanks so much for stopping by and visiting! If you have any comments or questions, please feel free to leave them on the blog or email me at bobsadviceforstocks@lycos.com. If you get a chance, be sure and visit my Stock Picks Podcast Website.
Bob
Friday, 27 April 2007
Curtiss-Wright (CW) "Revisiting a Stock Pick"
Hello Friends! Thanks so much for stopping by and visiting my blog, Stock Picks Bob's Advice! As always, please remember that I am an amateur investor, so please remember to consult with your professional investment advisers prior to making any investment decisions based on information on this website.
Earlier today I sold my position on Jones Soda (JSDA) as it had declined to a 30% gain for me (1/2 of my top % sell target reached). This brings me down to 19 positions. It does not entitle me to add a new position, but rather to 'sit on my hands' as the sale was on 'bad' news. However, if I sell a portion of my remaining issues at a gain, well then I shall be once again on the lookout for that 20th position :).
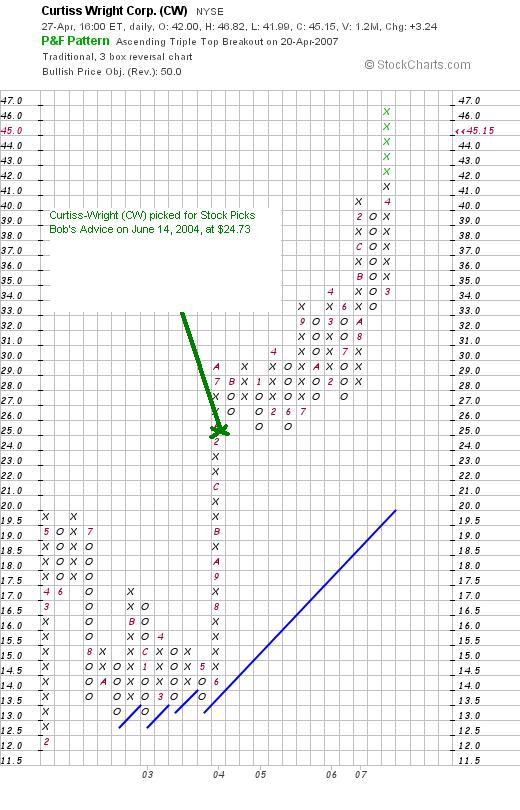
 As I like to do, I was looking through the list of top % gainers on the NYSE to see if I could find a name to discuss this afternoon. Curtiss-Wright (CW) an "old favorite" of mine was on the list and as I write is trading at $45.59, up $3.68 or 8.78% on the day. I say "old favorite" because I first posted CW on Stock Picks Bob's Advice almost three years ago on June 14, 2004, when the stock was trading at $49.46. CW actually had a 2:1 stock split on April 24, 2006, so this makes my effective pick price actually only $24.73. With the stock trading at $45.62, this represents a gain of $20.89 or 84.5%. Unfortunately, I did not then, and I do not now own any shares or options on this company.
Let's take a closer look at this stock and I shall show you why it deserves a place on this blog and why
CURTISS-WRIGHT (CW) IS RATED A BUY
 What exactly does this company do?
According to the Yahoo "Profile" on Curtiss-Wright (CW), the company
"...engages in the design, manufacture, and overhauling of products for motion control and flow control applications worldwide. It operates through three segments: Flow Control, Motion Control, and Metal Treatment."
How did they do in the latest quarter?
Without trying to sound like a 'broken record', (are you all old enough to rember those 33's with the scratches that skipped?), it was the announcement of 1st quarter 2007 results yesterday after the close of trading that drove the stock higher today! Net sales for the quarter ended March 31, 2007, increased 18% to $332.6 million from $282.6 million in the same quarter last year. Net earnings increased 59% to $19.5 million or $.44/diluted share, up from $12.3 million, or $.28/diluted share in the same period in 2006.
The company beat expectations of $.35/share according to Thomson Financial on revenue of $307.2 million.
What about longer-term results?
Examining the Morningstar.com "5-Yr Restated" financials on CW, we can see that revenue has been steadily expanding from $513 million in 2002 to $1.1 billion in 2005 and $1.28 billion in 2006. Earnings during this period have also steadily increased from $1.08/share in 2002 to $1.82/share in 2006.
As if that wasn't enough, the company also pays a dividend and has been steadily increasing it from $.11/share in 2002 to $.24/share in 2006. They have also kept a steady hand on the outstanding shares which have increased less than 10% from 41 million in 2002 to 44 million in 2006. During the same time period, revenue has grown more than 100%, earnings have increased 80% and the dividend has more than doubled. This is a nominal dilution of shares in a rapidly growing company.
Free cash flow has been positive and basically growing recently with $73 million in 2004, dipping to $63 million in 2005, but increasing to $104 million in 2006.
The balance sheet, as presented by Morningstar.com, appears solid with $124.5 million in cash and $498.1 million in other current assets. This total of $622.6 million in current assets, when compared to the $292.1 million in current liabilities yields a current ratio of 2.13. In addition, the company is reported to have $538.0 million in long-term liabilities.
What about some valuation numbers?
Reviewing Yahoo "Key Statistics" on Curtiss-Wright (CW), we can see that this is a mid cap stock with a market capitalization of $2.02 billion. The trailing p/e is a moderate 25.18 with a forward p/e (fye 31-Dec-08) estimated at 19.06. The PEG ratio (5 yr expected) is estimated at a reasonable 1.52.
According to the Fidelity.com Eresearch website, the Price/Sales (TTM) is a tad rich at 1.44 compared to an industry average of 1.39. Also, the company is a bit less than average in profitability as measured by the Return on Equity (TTM) coming in at 11.40%, under the industry average per Fidelity of 20.91.
Finishing up with Yahoo, we can see that there are 44.18 million shares outstanding with 40.20 million that float. Of these that float, 3.50 million are out short with a short ratio of 14.4. This represents 8% of the float and is very significant from my perspective. This is reflected in today's move higher on good news with a volume of 1.1 million shares when the average daily volume on CW is 244,521. The shorts are most likely feeling a bit of a "squeeze" on this stock!
The company, as I noted above, pays a dividend of $.24/share (forward rate) yielding 0.6%. The last stock split was a 2:1 split 4/24/06.
What does the chart look like?
Looking at a "Point & Figure" chart from StockCharts.com, we can see that the stock appreciated from $12 to $20 early in 2002, only to pull back to the $13 level. After June, 2003, the stock started moving strongly higher and has been appreciating strongly since.
Summary: What do I think?
Needless to say I like this stock a lot! The quarterly report was solid, the Morningstar.com page was excellent. I like the fact the company pays a dividend and has been growing it. The balance sheet is fine. Some of the valuation numbers suggest the stock is richly priced, but I suspect if the current quarter continues, estimates will rise, and numbers like PEG, Price/
sales, Return on Equity, which are a bit rich, will improve. On top of it there are loads of short-sellers betting against the stock. Finally the chart looks very strong.
Thanks again for visiting! If you have any comments or questions, please feel free to leave them on the blog or email me at bobsadviceforstocks@lycos.com. If you get a chance be sure and visit my Stock Picks Podcast Website where you can hear me talk about some of the many stocks I write about here on this website.
Have a great weekend everyone!
Bob
Jones Soda (JSDA) "Trading Transparency"
Hello Friends! Thanks so much for stopping by and visiting my blog, Stock Picks Bob's Advice! As always, please remember that I am an amateur investor, so please remember to consult with your professional investment advisers prior to making any investment decisions based on information on this website.
A few moments ago I sold my remaining 215 shares of Jones Soda (JSDA) at $23.55/share. I had purchased these shares just last month on 3/12/07 at a price of $18.22/share so this represented a gain of $5.33/share or 29.3% on the purchase.
Why did I sell? This sale was simply a result of the price movement of Jones more than any fundamental issue. It may well be a mistake to have sold this stock as I do not particularly see anything fundamentally wrong with the company. It is just an extremely volatile stock that hit my own sale target on the downside.
You may recall, if you follow this blog, that I have a very disciplined selling strategy for the stocks I own. I sell stocks slowly and partially on the upside at appreciation targets of 30, 60, 90, 120, 180, etc. % targets. On the downside, after an initial purchase I sell a stock if it declines 8%. If I have sold once at a gain, I allow the stock to go to break-even before unloading it. If I have sold the stock more than once, I allow the stock to go to 50% of the highest appreciation sale and then sell the remaining shares.
After purchasing Jones on 3/12/07, the stock quickly appreciated, and I sold 50 shares of my 300 on 4/4/07 at a 30% appreciation point, another 35 shares on 4/16/07 at a 60% appreciation point. With the stock now declining back to the 30% appreciation level, a sale was triggered (even if I do it manually!) to unload all of my shares. And I did.
I hope this was the right move. My strategy depends on disciplined trading and management of my portfolio. Time will tell if it is a good approach. I am not certain. But I intend to stick to my rules even if it does occasionally mean parting with a stock that later goes to higher price levels.
If you have any comments or questions, please feel free to leave them on the blog or email me at bobsadviceforstocks@lycos.com.
Bob
Thursday, 26 April 2007
ITT Educational Services (ESI) "Revisiting a Stock Pick"
Hello Friends! Thanks so much for stopping by and visiting my blog, Stock Picks Bob's Advice! As always, please remember that I am an amateur investor, so please remember to consult with your professional investment advisers prior to making any investment decisions based on information on this website.
 I was looking through the list of the top % gainers on the NYSE today and saw that an old favorite of mine, ITT Educational Services (ESI) had made the list, trading at $91.25, up $7.88 or 9.45% today as I write. I do not own any shares of ESI nor do I have any options on this stock.
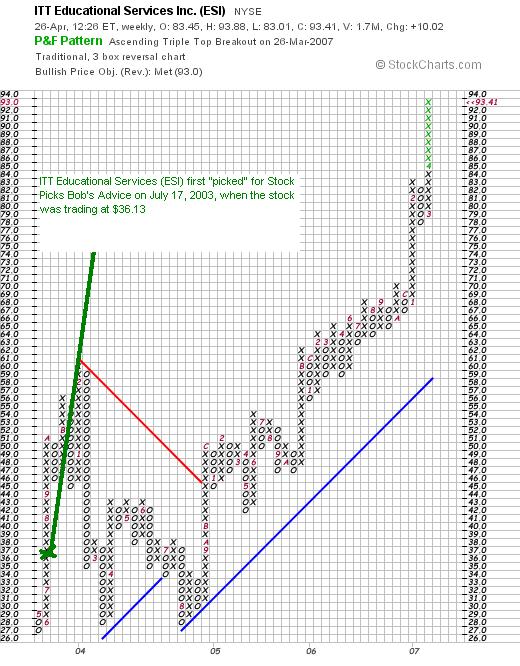
I say "revisit" and an "old favorite" because it has been several years since I first reviewed ESI. This stock was written up early on this blog, when I wrote up ESI on July 17, 2003, when the stock was trading at $36.13. With the stock currently trading at $93.62 (as I write), this represents a gain of $57.49/share or 159.1% since posting!
Because of the nice move today, and the rest of the information I will review on this entry,
ITT EDUCATIONAL SERVICES (ESI) IS RATED A BUY
What exactly does this company do?
According to the Yahoo "Profile" on ESI, the company
 "...provides postsecondary degree programs in the United States. It offers diploma, associate, bachelor, and master degree programs in the fields of information technology, electronics technology, drafting and design, business, criminal justice, and health sciences."
How did they do in the latest quarterly report?
As I have found myself saying over and over again on the blog, it was the report of 1st quarter 2007 results today before the opening of trading that produced the big price appreciation in the stock! Revenue for the three months ended March 31, 2007, increased 15.8% to $204.2 million from $176.3 million in the same quarter in 2006. Net income climbed 34.8% from $20.5 million in 2006 to $27.6 million in the latest quarter. Diluted earnings per share increased even more, up 46.7% from $.45/share to $.66/share in 2007.
As part of this terrific earnings report, the company went ahead and raised guidance for 2007 earnings from $3.17 to $3.21 to the new range of $3.40 to $3.50/share.
The reported earnings beat expectations of $.54/share (they came in at $.66/share) and revenue of $198.4 million (they came in at $204.2 million) per analysts at Thomson Financial. Thus, the company did what I call the "trifecta-plus", by reporting terrific revenue growth, earnings growth, beating expectations on both, and raising guidance! As if this wasn't enough, the company added a bit of "icing on the cake" by announcing an increased buyback of shares, adding an additional 5 million shares to its repurchase plans.
How about longer-term financial results?
Reviewing the Morningstar.com "5-Yr Restated" financials, we can see the steady increase in revenue from $454 million in 2002 to $758 million in 2006. Earnings have also been steadily increasing from $.94/share in 2002 to $2.33/share in 2005 and $2.72/share in 2006. The company does not pay a dividend. However, unlike most stocks I review on this blog, the company has been reducing its outstanding shares, with 46 million reported in 2002, down to 43 million in 2006 and 41 million in the trailing twelve months (TTM). Whenever a company buys back shares this serves both to improve financial results, by dividing earnings by a fewer number of shares, as well as directly driving up the price of shares by adding demand to the marketplace.
Free cash flow has been positive with $107 million in 2004, $133 million in 2005 and $121 million in 2006.
The balance sheet, as reported by Morningstar.com, appears solid with $356.9 million in cash alone, enough to pay off all of the $284.5 million in current liabilities and much of the $171.9 million in long-term liabilities as well. Combining the cash and other current assets gives us a total of $380.9 million in total current assets, which, when compared to the $284.5 million in current liabilities yields a current ratio of 1.34. Generally ratios of 1.25 or higher are satisfactory.
What about some valuation numbers?
Checking Yahoo "Key Statistics" on ESI, we find that this is a mid cap stock with a market capitalization of $3.85 billion. The trailing p/e is a tad rich at 34.55, but the forward p/e of 24.76 is a bit more reasonable (fye 31-Dec-08) as estimated. The PEG is also reasonable at 1.30 (5 yr expected).
In another assessment of valuation, using the Fidelity.com eresearch website, we can see that the Price/Sales (TTM) is priced a bit richly at 4.63, compared to an industry average of 2.65. However, the company is far more profitable than its peers, with a Return on Equity (TTM), according to Fidelity, coming in at 89.07% (TTM), compared to an industry average of only 3.52%. I guess you get what you pay for :).
Finishing up with Yahoo, we find that there are 41.08 million shares outstanding but only 34.27 million that float. Of these, 1.33 million shares were out short as of 3/12/07, representing a slightly significant 4.4 trading days of volume (the short ratio). Today's volume of 1.37 million shares thus far may well represent some of the short-sellers feeling the 'squeeze' and scrambling to buy shares to close out their positions. The normal average trading volume for this stock is only 333.5 thousand shares.
As I noted, the company does not pay a dividend and the last stock split was a 2:1 split back in June 6, 2002.
What does the chart look like?
Examining the "Point & Figure" Chart on ESI from StockCharts.com, we can see that the stock actually traded rather poorly between April, 2003, when the stock was at $27, to a high of $61 in February, 2004, then fell back to the $28 level where it hit twice before moving sharply higher after July, 2004, and moving to its current level of around $93.
Summary: What do I think?
I wrote this stock up because I like this stock :). The company has been a great performer for me even if I don't own the stock. Their latest quarterly report out today was great. They reported strong results, beat expectations, raised guidance, and announced an additional stock buyback! Longer-term, they have been a solid performer fundamentally with steady revenue and earnings growth, free cash flow solidly positive, a reduction in the number of shares outstanding and a solid balance sheet.
Valuation-wise, the p/e is a bit rich as is the Price/sales ratio. However, the PEG suggests that growth will be sufficient to justifify the p/e, and the return on equity suggests that the incredible profitability of this company may well justify the premium in the price. Finally the chart looks very strong if a bit over-extended.
Thanks again for dropping by and visiting! If you have any comments or questions, please feel free to leave them on the blog or email me at bobsadviceforstocks@lycos.com. If you get a chance, be sure and visit my Stock Picks Podcast Website!
Bob
Wednesday, 25 April 2007
Teledyne Technologies (TDY)
Hello Friends! Thanks so much for stopping by and visiting my blog, Stock Picks Bob's Advice! As always, please remember that I am an amateur investor, so please remember to consult with your professional investment advisers prior to making any decisions based on information on this website.
CLICK HERE FOR MY PODCAST ON TELEDYNE TECHNOLOGIES (TDY)
 I am always on the 'look-out' for new stock market investment ideas! These are the stocks that make up my blog, the stocks that I call my "vocabulary" of investing. It is from these stocks that I have built my portfolio. These are the companies that fit my profile of investable companies. Teledyne Technologies (TDY) appears to fit the bill for me!
When I first start looking for a new name to write up here on the blog, I simply go over to the list of top % gainers and see if any of the stocks making nice moves higher, either on the AMEX, the NASDAQ, or the NYSE deserves a spot on the blog. I do not check every stock. I do not even look every day. But when I get a chance, if I find anything I try to write it up, and this serves me well in learning about the company as well as offers my readers a chance to perhaps learn about a stock that they haven't considered before.
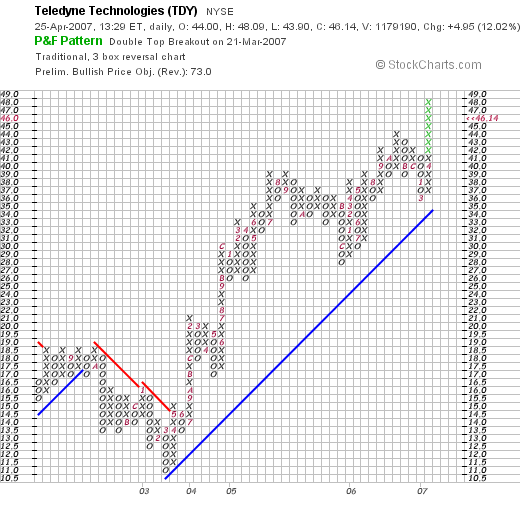
Teledyne (TDY) made the list today, and as I write, is trading at $46.33, up $5.14 or 12.48% on the day. I do not own any shares nor do I have any options on this stock. Let me go over the things that I saw that made me think it was a good "pick".
TELEDYNE (TDY) IS RATED A BUY
What exactly does this company do?
 If we look at the Yahoo "Profile" on Teledyne, we can see that the company
"...provides electronic components, instruments, and communications products in United States, Europe, Japan, and Canada. It operates in four segments: Electronics and Communications, Systems Engineering Solutions, Aerospace Engines and Components, and Energy Systems."
How did they do in the latest quarter?
Shortly before the open today, Teledyne announced what I consider a very strong 1st quarter 2007 earnings report. As they noted, revenues climbed 16.8% to $385.6 million compared to sales of $330.2 million last year. Net income worked out to $20.5 million or $.57/diluted share, up from $17.9 million or $.51/diluted share in the same period last year.
One of the important part of any earnings announcement is the expectations on earnings. In this case, Teledyne beat expectations, which, according to Thomson Financial, analysts were expecting revenue of $383.3 million, and earnings of $.50/share.
As also reported, the company raised guidance:
"For the full year, Teledyne now expects earnings of $2.50 to $2.54 a share, excluding options expense and other items. It had in January forecast earnings of $2.41 to $2.44 a share for the year on the same basis.
Analysts were expecting earnings of $2.39 a share for the full year, excluding exceptional items, according to Reuters Estimates." In my 'lingo', I call this a "trifecta-plus", which is like getting 'straight A's in middle school'! That is, a near perfect report card from the company which reported increasing revenue, increasing earnings, beat expectations, and raised guidance! Everything an investor hoping for appreciation in a stock price could wish for!
How about longer-term results?
In my idiosyncratic stock-picking technique, I am not looking for a 'one quarter wonder'. I am looking for a company with the kind of management and business able to consistently produce good or great financial results. For this information I have been turning to Morningstar.com, in particular the "5-Yr Restaqted" financials page.
Reviewing the "5-Yr Restated" financials on TDY from Morningstar, we can see that revenue has grown steadily with $773 million in 2002 increasing to $1.43 billion in 2006. Earnings have also increased steadily from $.77/share in 2002 to $2.26/share in 2006. Meanwhile, the company has maintained a very steady hand on the outstanding shares with 32 million in 2002 and $35 million reported in 2006. While this is an increase of a bit under 10%, revenue has nearly doubled and earnings have nearly tripled. This is a very acceptable dilution of the shareholders' equity interest.
Free cash flow has been positive recently but not particularly increasing with $66 million in 2004, $73 million in 2005 and $52 million reported in 2006.
The balance sheet appears solid with $13 million in cash and $433.8 million in other current assets. This total of $446.8 million, when compared to the current liabilities of $230.4 million yields a current ratio of 1.94. Generally, current ratios of 1.25 or higher are considered 'healthy'. The company also has $399.2 million in long-term liabilities per Morningstar.
How about some valuation numbers on this stock?
Looking at Yahoo "Key Statistics" on TDY, we can see that this is a mid cap stock with a market capitalization of $1.61 billion. The trailing p/e is a very moderate 20.46 with a forward p/e (fye 31-Dec-08) estimated at 17.27. Thus, with the rapid growth in earnings expected, the PEG (5 yr expected0 works out to a nice 1.16. (As I have written elsewhere, I like to see PEG's between 1.0 and 1.5 for a 'reasonable' valuation.)
Checking the Fidelity.com eresearch website on valuation also reveals good valuation information that the Price/Sales (TTM) for TDY comes in at .99, below the industry average of 1.40. From a 'profitability' perspective, TDY comes in just below the industry average of 20.66 return on equity with a 20.28% ROE figure (TTM).
Finishing up with Yahoo, we can see that the company has 34.85 million shares outstanding with 31.46 million that float. As of 3/12/07, there were 1.97 million shares out short, representing 6.1 trading days of volume (the short ratio) or 5.9% of the float. My own figure of 3 days for a cut-off of significance, suggests that we may well be seeing a bit of a short-squeeze on the short-sellers today, as the company reported strong results ahead of expectations, buyers came into the market, and the short sellers added to the stampede as they sought to close out their 'pre-sold' short positions, by adding shares to actually cut their losses. I do not have any information on this beyond this statistic, but it does make a person wonder!
What about the chart?
If we examine a "Point & Figure" chart on Teledyne from StockCharts.com, we can see a very strong price chart with a stock moving strongly higher from a low in the $11 range in March, 2003, to its current level of $46. The chart looks strong to me!
Summary: What do I think?
Basically, I like this stock a lot! The company reported great numbers today in the face of a significant short interest, exceeding expectations and going ahead and raising guidance. They have been performing well for several years, have a reasonable valuation, a strong chart, and a solid financial underpinning. If I were in the market to buy shares today, this is the kind of stock I would be buying, it deserves a spot on my blog and a place in my 'vocabulary' of stocks!
Thanks so much for stopping by! If you have any comments or questions, please feel free to leave them on the blog or email me at bobsadviceforstocks@lycos.com. If you get a chance, be sure and visit my Stock Picks Podcast Website, where when I get a chance, I like to discuss some of the many stocks I write about here on the blog.
Bob
Posted by bobsadviceforstocks at 12:58 PM CDT
|
Post Comment |
Permalink
Updated: Wednesday, 25 April 2007 8:16 PM CDT
Monday, 23 April 2007
Harsco (HSC)
Hello Friends! Thanks so much for stopping by and visiting my blog, Stock Picks Bob's Advice! As always, please remember that I am an amateur investor, so please remember to consult with your professional investment advisers prior to making any investment decisions based on information on this website.
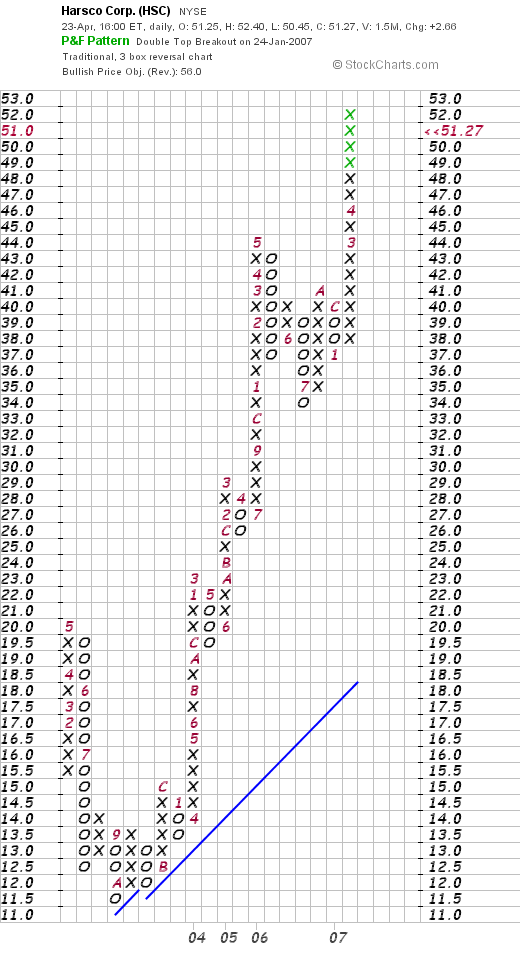
 This evening, looking at the list of top % gainers on the NYSE, I saw that Harsco Corporation (HSC) had made the list. HSC closed at $51.27, up $2.66 or 5.47% on the day. I believe Harsco (HSC) deserves a spot on this blog. I do not own any shares nor do I have any options on this stock.
HARSCO (HSC) IS RATED A BUY
 What exactly does this company do?
According to the Yahoo "Profile" on Harsco, the company
"...provides industrial services and engineered products primarily to steel, construction, railways, and energy industries. It operates in three segments: Mill Services, Access Services, and Gas Technologies."
How did they do in the latest quarterly report?
It was the announcement of 1st quarter 2007 results this morning before the market opened that resulted in the sharp price appreciation today. First quarter sales increased 23% to $840 million from sales of $682 million last year. Diluted earnings per share of continuing operations came in at $.54, up 39% from $.39/share in the same quarter in 2006.
In the same report, the company also raised guidance for 2007 from $2.52 to $2.57 to the new estimates of $2.69 to $2.74/share.
The company beat expectations of $.43/share on revenue of $769.1 million. Thus, the earnings report really was what I call a "trifecta-plus". Everything was Goldilocks said "just right"....increasing revenue, increasing earnings, beating expectations and raising guidance. What else could an investor want? Not much apparently, as the stock price charged ahead in an otherwise anemic market.
How has the company done longer-term?
For that I turn to the Morningstar.com "5-Yr Restated" financials on Harsco. Here we can see the record of steady revenue growth from $1.98 billion in 2002 to $3.4 billion in 2006. Earnings during this period rose just as consistently from $1.11/share in 2002 to $2.33/share in 2006. The company also pays a dividend (an added plus!) with $.50/share paid in 2002, increasing it each year to $.65/share in 2006. Meanwhile, the company has kept a pretty tight hold on the outstanding shares with 81 million in 2002 increasing only to 84 million, less that a 5% increase, by 2006. During the same period, the revenue almost doubled and the earnings climbed by more than 100%.
Free cash flow has been positive and improved recently. The company reported $66 million in free cash flow in 2004, $25 million in 2005 and $69 million in 2006.
The balance sheet, as reported by Morningstar.com, appears adequate with $101.3 million in cash and $1.13 billion in other current assets. This total of $1.23 billion, when compared with the $.91 billion in current liabilities, yields a satisfactory current ratio of 1.35. The company has an additional $1.27 billion in long-term liabilities.
What about some valuation numbers on this stock?
Examining the "Key Statistics" on Harsco from Yahoo, we find that this is a mid cap stock with a market capitalization of $4.31 billion. The trailing p/e is a reasonable (imho) 22.04, with a forward p/e (fye 31-Dec-08) even nicer at 17.68. The PEG ratio (5 yr expected) comes in at what I view as an acceptable 1.35.
Reviewing the Fidelity.com eresearch website, we can see that Harsco (HSC) comes in with a reasonable Price/Sales (TTM) ratio of 1.19, below the industry average of 1.39. However, the profitability figure of a Return on Equity (TTM) of 17.74%, is not as impressive as the industry average of 23.55%.
Yahoo shows that there are 84.03 million shares outstanding with 83.49 million that float. The company has a relatively low number of shares out short: 669,080 shares, as of 3/12/07, representing 0.8% of the float or 1.7 trading days of volume.
The company pays a forward dividend of $.71/share yielding 1.5%. The company also just split its shares 2:1 on March 21, 2007.
What does the chart look like?
If we examine the "Point & Figure" chart on HSC from StockCharts.com, we can see that except for a dip from May, 2003, when the stock was trading at around $20, down to a low of $11.50 in October, 2003, the stock has subsequently traded strongly higher. This chart looks strong to me, if perhaps a bit overextended (?).
Summary: What do I think?
In a word or two, I like this stock a lot. The latest quarter's earnings (out today) were quite strong, beating expectations and the company went ahead and raised guidance. The past several years have had the company growing revenue steadily, increasing earnings regularly, and consistently increasing the dividend. That is often a winning combination! The company is generating free cash flow, has maintained the # of shares outstanding stable, and has a satisfactory balance sheet.
Valuation-wise, the Price/Sales is reasonable and the Return on Equity is close to the industry average. Finally, the chart looks strong. This company deserves a spot in my "vocabulary". I have not sold any stocks at a gain entitling me to add a new position, and in fact, at 20 positions, I am currently 'maxed-out'.
Thanks so much for stopping by and visiting! If you have any comments or questions, please feel free to leave them on the blog or email me at bobsadviceforstocks@lycos.com. If you get a chance, be sure and visit my Stock Picks Podcast Website.
Bob
Posted by bobsadviceforstocks at 11:21 PM CDT
|
Post Comment |
Permalink
Updated: Wednesday, 25 April 2007 9:47 AM CDT
Saturday, 21 April 2007
Universal Electronics (UEIC) "Weekend Trading Portfolio Analysis"

Hello Friends! Thanks so much for stopping by and visiting my blog Stock Picks Bob's Advice! As always, please remember that I am an amateur investor, so please remember to consult with your professional investment advisers prior to making any investment decisions based on information on this website.
One of my weekend 'tasks' that I have given myself is to review one of my holdings in my Trading Account every other weekend. Two weeks ago I reviewed my holding in Starbucks (SBUX). I am now up to my full complement of 20 positions in my account (I have decided to top out at 20 instead of 25 to allow my margin balance to begin being paid off...hopefully!). Thus it should take me about 40 weeks to completely go through the list...and figuring on an occasional missed week, then about a year for the cycle. I am going alphabetically by symbol and am now up to Universal Electronics (UEIC)
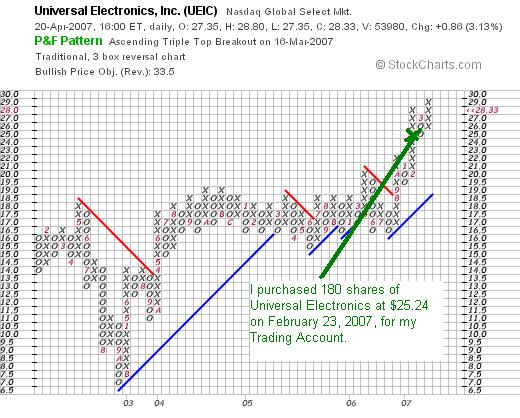
I currently own 180 shares of Universal Electronics with a cost basis of $25.24 that were acquired February 23, 2007, just a couple of months ago. UEIC closed at $28.33 on April 20, 2007, for an unrealized gain of $3.09 or 12.2% since my purchase. When am I planning to sell? On the downside, if the stock should decline to an 8% loss or .92 x $25.24 = $23.22, then I shall be selling all of my shares. On the upside, I shall plan on selling 1/7th of my holding or 180/7 = 25 shares, if the stock should reach a 30% appreciation target, my first targeted sale, or 1.3 x $25.24 = $32.81. Thus far, in the past two months, I have not sold any shares of this holding.
Let's take a closer look at this company and see if it still deserves a spot in my portfolio and whether it belongs in my blog!
UNIVERSAL ELECTRONICS (UEIC) IS RATED A BUY
 What exactly does this company do?
According to the Yahoo "Profile" on UEIC, the company
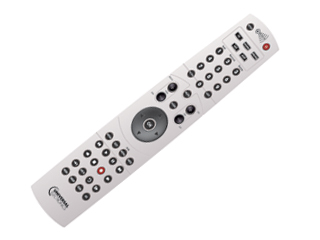
"...provides pre-programmed wireless control products and audio-video accessories for home entertainment systems. Its products include standard and touch screen remote controls; antennas; and various audio/video accessories, including digital antennas, signal boosters, television brackets, and audio and video cleaning products, as well as microcontrollers."
 How did they do in the latest quarter?
On February 22, 2007, UEIC reported 4th quarter results. For the quarter ended December 31, 2006, net sales were $69.7 million, up nicely from $49.3 million in the same period the prior year. Net income for the 2006 fourth quarter was $5.4 million, or $.37/diluted share, up 50% from last year's $3.5 million or $.25/diluted share.
This result beat expectations of analysts from Thomson Financial that were expecting earnings of $.32/share. The company also raised guidance in the same report, boosting 2007 earnings estimate to $1.13 to $1.23/share, with sales between $260 and $271 million. Apparently current expectations are at $1.09/share. The combination of strong earnings results, beating expectations, and raising guidance was the source of my original interest in purchasing shares of this company.
How about longer-term financial results?
Reviewing the Morningstar.com "5-Yr Restated" financials, we can see that revenue, which dipped from $119 million in 2001 to $104 million in 2002, has subsequently climbed steadily to $181 million in 2005 and $215 million in the trailing twelve months (TTM).
Earnings follow a similar pattern, dipping from $.78/share in 2001 to $.42/share in 2002, however, they have climbed steadily since to $.69/share in 2005 and $.81 in the TTM. Also attractive is the stability in the outstanding shares with 14 million recorded in 2001, unchanged at 14 million in the TTM.
Free cash flow has been positive but erratic with $17 million reported in 2003, $1 million in 2004, $11 million in 2005 and $9 million in the TTM.
The balance sheet is solid with $57.3 million in cash, which by itself can easily cover both the $49.4 million in current liabilities and the small $100,000 in long-term debt. Calculating the current ratio, the combined current assets total $143.6 million, which, when divided by the $49.4 million in current liabilities yields a healthy ratio of 2.91. This ratio is particularly noteworth because of the virtual absence of any long-term liabilities as reported by Morningstar.com.
What about some valuation numbers?
Looking at the Yahoo "Key Statistics" on UEIC we can see that this is a small cap stock with a market capitalization of only $404.44 million. The trailing p/e is a bit rich at 30.23 but the forward p/e (fye 31-Dec-08) is estimated at a more reasonable 19.95. Thus, with rapid growth, the PEG ratio (5 yr expected) is 1.16. I like PEG's that are between 1.0 and 1.5 as being 'reasonably priced'. UEIC fits the bill!
Another aspect of valuation is Price/Sales. I always like to credit Paul Sturm from Smart Money who wrote a great article on using the Price/Sales ratio by comparing it to other companies in the same type business. In this case, Universal Electronics is reported to have a Price/Sales ratio of 1.66 which is actually higher than the industry average of 1.17, meaning the stock is priced at a premium to similar companies in the same industry.
Looking at Return on Equity as a measure of profitability, UEIC comes in close to the average at 11.14%, with an average ROE (TTM) in its industry recorded at 11.29% by Fidelity.
Finishing up with Yahoo, we can see that there are 14.28 million shares outstanding and 14.13 million that float. There are 688,580 shares out short as of 3/12/07, representing 3.4 trading days of volume (the short ratio). I use a 3 day cut-off for 'significance' in this ratio. So this is borderline significant...with more shares out short being a bullish factor.
No dividends are reported and the last stock split per Yahoo was a 2:1 split in February, 2000.
What does the chart look like?
Examining the "Point & Figure" chart on UEIC from StockCharts.com, we can see what appears to me to be a "cup and handle" chart pattern, which usually is recorded in a 'bar chart'. In any case, the stock which has been consolidating for almost three years between the $15 and $18 level, appears now to have clearly broken-out to the $29 level. The chart looks encouraging to me.
Summary: What do I think about this stock?
I still like this stock and still rate it a "buy". I do own shares now so that should be taken into consideration. However, the latest quarter was very strong, with both earnings and revenue growth and the company exceeding expectations on earnings. In addition, they raised guidance on future revenue. The Morningstar.com report looks solid with steady revenue and earnings growth the past several years, maintenance of a steady number of shares outstanding, free cash flow generation, and a solid balance sheet.
Valuation-wise, the PEG is below 1.5, but the Price/Sales is a bit rich relative to similar companies, and the ROE is fairly average. Finally, the chart looks encouraging.
Thanks again for visiting my blog. If you have any comments or questions, please feel free to leave them right on the website or email me at bobsadviceforstocks@lycos.com. If you get a chance, be sure and visit my Stock Picks Podcast Website where I discuss some of the stocks that I have written about here on the blog.
Have a great weekend everyone!
Bob
"Looking Back One Year" A review of stock picks from the week of December 5, 2005
Hello Friends! Thanks so much for stopping by and visiting my blog, Stock Picks Bob's Advice! As always, please remember that I am an amateur investor, so please remember to consult with your professional investment advisers prior to making any investment decisions based on information on this website.
It is another weekend and another opportunity to look back at past stock selections on this blog. As I like to point out on these reviews, my evaluations assume a "buy and hold" strategy on each stock purchase, with equal amounts of money used to purchase each of the stocks held that week. Of course in reality, I purchase only a very small number of stocks that I discuss on this blog. I refer to my actual purchases as part of my "Trading Portfolio". Those purchases are real transactions. The rest of my picks are just stocks that I view as "investable" and they become part of my 'candidates list' or as I refer to them, part of my "vocabulary" of investing!
In practice, I employ a very disciplined portfolio management approach to all of the stocks I own. I do not use a buy and hold strategy at all in reality. I sell my losing stocks quickly and completely and sell my gaining stocks slowly and partially at targeted appreciation points. This difference in strategy would certainly affect any performance (as has been pointed out to me multiple times), and should be taken into consideration when reading these reviews which assume this 'buy and hold' approach which I use for this review simply because it is easier to evaluate performance without a real-time reconstruction of price movement required by a disciplined portfolio strategy.
Well, that's enough of the disclaimers and warnings and explanations :). Let's take a look at the stocks discussed during that week in December, 2005. (I know it is more like a year-and-a-half out and not looking back a year at all. I am pretty sure I started out at a year out :), but then miss a week here and miss a week there and you know how that goes!)
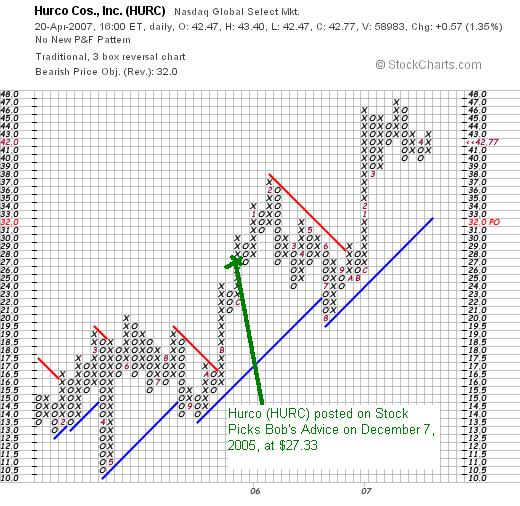
 On December 7, 2005, I posted Hurco Companies (HURC) on Stock Picks Bob's Advice when it was trading at $27.33. Hurco closed at $42.77 on April 20, 2007, for a gain of $15.44 or 56.5% since posting.
On February 16, 2007, Hurco reported 1st quarter 2007 results. Sales for the quarter ended January 31, 2007, came in at $26.9 million, up 47% from the year earlier period. Net income came in at $5.4 million or $.84/share, up sharply from the $3.0 million or $.48/share the prior year. Thus,
HURCO (HURC) IS RATED A BUY
Here is the "Point & Figure" chart on Hurco from StockCharts.com:
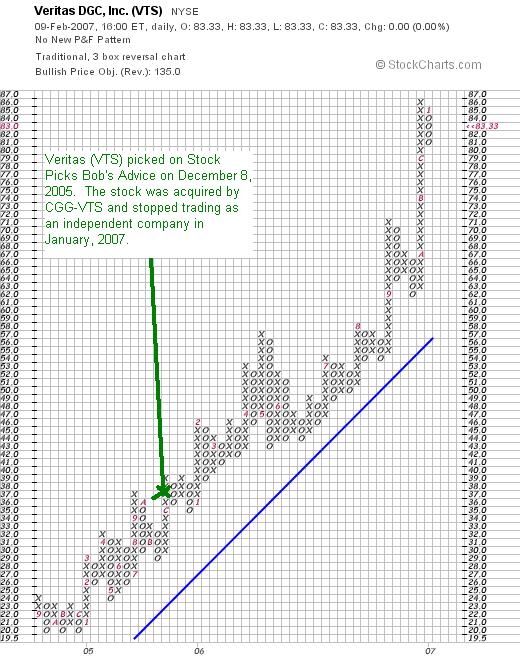
 On December 8, 2005, I posted Veritas DGC (VTS) on Stock Picks Bob's Advice when the stock was trading at $37.28. As reported VTS was acquired by Compagnie Generale de Geophysique (GGY). The company related:
" As you know, on September 4 th , Veritas and CGG signed a definite agreement whereby CGG would offer Veritas shareholders the equivalent of $37 in cash plus 1.14 CGG ADS per Veritas share. At the time of the announcement, this represented a 35% premium to Veritas’ previous 30-day average share price of $55.69. This agreement was anonymously approved by both CGG’s and Veritas’ board of directors. We are in the process of filing various documents with the regulatory and stock exchange authorities. On September 25 th , we made our ... filing and expect that the Form F-4 will be filed with the SEC and the ... will be filed with the French AMF in the next two weeks. Other country filings are ongoing."
Trying to reconstruct the current value of the acquisition, with Compagnie Gnrale de Geophysique-Veritas trading at $41.61 on April 20, 2007, this would give the value of that acquisition at $37 + (1.14)($41.61) = $37 + $47.43 = $84.43. This would have meant a gain of $47.15 or 126.5% since posting.
Here is the "Point & Figure" chart on VTS up to the last day of trading as an independent company in January, 2007.
So how did I do with these two "picks" from December, 2005. In a word phenomenal! Hurco was up 56.5% since my post, and VTS climbed 126.5% with an acquisition! This was an average gain of 91.5% on these two stock picks. This is an unusual week even for me. The past couple of reviews have shown negative returns, so do NOT expect this is typical! However, it is nice to have a couple of good picks, isn't it?
Remember that past performance is not a good indicator of future performance and that all investments are subject to losses! (I need a couple of extra disclaimers after a great week picking stocks to review!)
I hope you all have a great weekend! If you have any comments or questions, please feel free to leave them on the blog or email me at bobsadviceforstocks@lycos.com. Also, feel free to drop by and visit my Stock Picks Podcast Website where I talk about some of the many stocks I have looked at here on the blog!
Bob
Newer | Latest | Older


