Stock Picks Bob's Advice
Saturday, 12 April 2008
"Looking Back One Year" A review of stock picks from the week of September 25, 2006

Hello Friends! Thanks so much for stopping by and visiting my blog, Stock Picks Bob's Advice! As always, please remember that I am an amateur investor, so please remember to consult with your professional investment advisers prior to making any investment decisions based on information on this website.
It is the weekend once again! (Do these weeks seem to fly by for anyone else as well?). Anyhow, I like to review past stock picks on weekends and update my ratings evaluations. So many things have changed this past year. And not all for the better!
Last weekend I took a look at the stocks discussed on this blog during the week of September 18, 2006. Going a week ahead, let's review the stocks 'picked' on this blog during the week of September 25, 2006. I know that it is a bit more than a year....more like a year-and-a-half....but when I started these reviews, it was a year....and then I missed a review one weekend....and then one thing led to another, and now my review is more than a year out. Anyhow.....let's get on with this review :).
These reviews assume a buy and hold approach to investing. In practice, I advocate and employ a disciplined investment strategy that requires quick and total sales on declines and partial sales as stocks reach appreciation targets on the upside. Without a doubt the difference in employing these two strategies to the same group of stocks would certainly affect performance and you should keep this in mind.
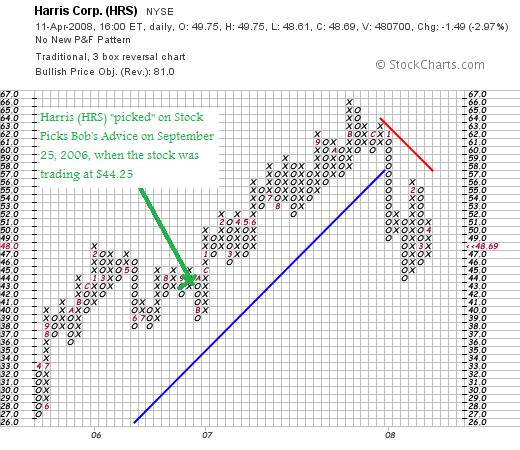
 On September 25, 2006, I posted Harris Corporation (HRS) on Stock Picks Bob's Advice when the stock was trading at $44.25. Harris closed at $48.69 on April 11, 2008, for a gain of $4.44 or 10% since posting. I do not own any shares or options on Harris.
On January 30, 2008, Harris (HRS) announced 2nd quarter 2008 results. Revenue for the quarter came in at $1.3 billion, up 30% from the $1.0 billion reported in the same quarter the prior year. This also represented a 7% sequential increase in revenue.
Net income for the quarter came in at $114 million or $.83/diluted share vs. $94 million or $.67/diluted share the prior year.
In the same announcement the company raised guidance for fiscal year 2008 to $5.2 to $5.3 billion with GAAP earnings guidance to $3.35 to $3.45/diluted share.
The company beat expectations on both earnings where $.81/share was expected and revenue where $1.25 billion was expected according to analysts polled by Thomson Financial.
Reviewing the Morningstar.com "5-Yr Restated" financials on Harris, we can see that the latest numbers show persistent revenue growth, steady earnings growth, steady dividend growth, stable outstanding shares, and continued solid free cash flow. The balance sheet appears solid.
Looking at the 'point & figure' chart on Harris from StockCharts.com, we can see that the stock was moving strongly higher from April, 2005, when the stock was trading as low as $27, until August, 2007, when it hit a high at $66/share. The stock broke through support in January, 2008, and although moving higher, it hasn't convincingly re-established the upward price move.
Thus, even with all of the good data presented, the best I can do...
HARRIS CORPORATION (HRS) IS RATED A HOLD

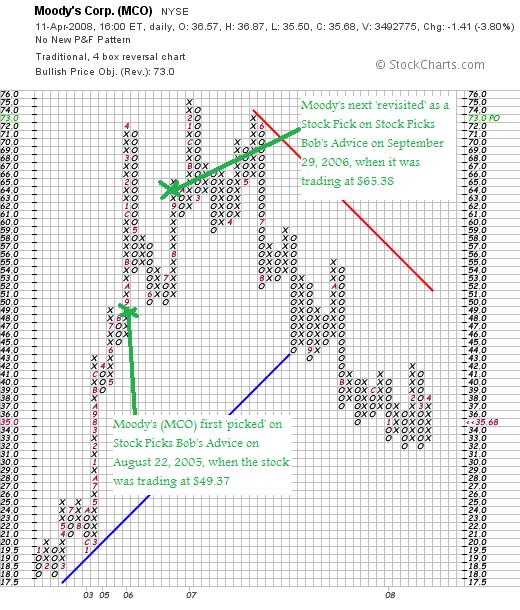
On September 29, 2006, I "revisited" Moody's (MCO) on Stock Picks Bob's Advice when the stock was trading at $65.38. I write 'revisit' because I first wrote up Moody's on this blog on August 22, 2005 when the stock was trading at $49.37. Moody's has not been immune from the near-meltdown of financial stocks we have observed and closed at $35.68 on April 11, 2008, for a loss of $(29.70) or (45.4)%. I do not have any shares or options on Moody's.
In terms of recent events, Moody's on March 11, 2008, cut the 2008 outlook due to 'shrinking bond issuance' with revenue now expected to shring in the 'mid-to-high-teens' from $2.3 billion in revenue last year. This was a revised estimate that was already predicting a decline in revenue in the 'low double-digits'.
On February 7, 2008, Moody's (MCO) announced 4th quarter 2007 results. Revenue for the three months ended December 31, 2007, declined 14% to $504.9 million from $590.0 million during the same period in 2006. Net income plunged to $127.3 millin from $278.6 million last year or $.49/diluted shear nearly 50% off the $.97/diluted share reported the prior year.
The Morningstar.com '5-Yr Restated' financials on Moody's (MCO) appears intact with sales growth steady, earnings growth stable (except for a flat 2007 at $2.58/share the same as 2006), dividends steadily increasing, and free cash flow positive and growing. The balance sheet, however, gives me pause with $426 million in cash and $563 million in other current assets. This total of $989 million, when compared to the $1,349.2 million in current liabilities yields a current ratio of .73.
At a minimum, a healthy current ratio is considered to be over 1.0. Moody's doesn't quite meet this level.
Reviewing the 'point & figure' chart on Moody's from StockCharts.com, we can see that the stock climbed sharply from January, 2002, when it was trading as low as $18 to a high of $75 in February, 2007, only to fail to reach that height in May, 2007, and then decline sharply from there, slipping below 'support' in August, 2007, as the stock dipped below $44. While seeming to be developing a new support in the $33 level, this is far from confirmed and convincing.
With the second lowering of guidance, the weak balance sheet on Morningstar.com and the very disconcerting chart on StockCharts.com, along with the entire credit meltdown that is ongoing,
MOODY'S (MCO) IS RATED A SELL
So how did I do with these two stock picks from the week of September 25, 2006? Well, except that I had the poor luck of including a financial company, it wouldn't have been that bad. O.K. no excuses, the two stocks combined for an average performance of a loss of (17.7)% since posting!
Thanks so much again for stopping by and visiting! If you have any comments or questions, please feel free to leave them on the blog or email me at bobsadviceforstocks@lycos.com.
If you get a chance, be sure and visit my Covestor Page where you can monitor and see an evaluation of my actual trading portfolio (email me if you would like an 'invite' to open a free account on Covestor....I have 4 invitations available :)), my SocialPicks Page where all of my stock picks from the last year or so have been reviewed, and my Podcast Page where you can listen to me discuss some of the many stocks and issues discussed on this website.
Have a wonderful weekend everyone!
Yours in investing,
Bob
Friday, 11 April 2008
How I Deal With Market Corrections!
I really thought about writing up another stock this evening.
Regular readers know that I like to write about stocks that I think deserve consideration based upon their price movement and underlying fundamentals.
But more important to me right now is dealing with the difficult trading environment and responding to market conditions within my own portfolio.
Many of you will have noted that I haven't been posting many "trading transparency" entries. Because I haven't been trading. My remaining six stocks haven't hit any sale points either on the upside or the downside. And without a signal to do anything, I haven't.
When markets correct and stocks decline there are multiple courses of action that are motivated by fear and greed. We believe we should justify our past decisions by buying more of the same stocks that have now declined on us and are thus 'better values'. At the same time, we may act in terror at a market decline and simply 'throw in the towel' and sell all of our positions swearing never to buy another stock again!
It is obvious to me that it is difficult to know exactly what to do in these trading environments. Is the market about to drop 200 points, or is it ready to climb 300 instead? Sentiment changes by the moment.

I have talked about the "Zen of Investing" elsewhere. Many people have also written about this "Zen" concept from Motley Fool to Zenway.com where they pledge to "hear the 'grasshopper' even in the midst of Wall Street thunders and storms.
James K. Glassman has also written about "Zen investing: smart and calm" For Glassman this means
"In the end, the best qualities for investors are the same ones Aristotle admired: moderation, common sense, restraint, modesty and integrity. Maybe, instead of five days of investor education, we should all sit down and read five days' worth of the ancient Greeks."
But somehow that doesn't get at what "Zen" is all about.
Barry Ritholtz probably gets it best when he writes and quotes Buddha:
"Do not believe in anything simply because you have heard it . . . Do not believe in traditions because they have been handed down for many generations. But after observation and analysis, when you find that anything agrees with reason and is conducive to the good and benefit of one and all, then accept it and live up to it.-Buddha"
Jon Kabat-Zinn has described the role of 'mindfulness' in becoming more aware of our worlds, whether they be investment worlds, or worlds full of people and family. He writes:
"Mindfulness is the other major classification of meditation practices, known as vipassana, or insight meditation. In the practice of mindfulness, you begin by utilizing one-pointed attention to cultivate calmness and stability, but then you move beyond that by introducing a wider scope to the observing, as well as an element of inquiry. When thoughts or feelings come up in your mind, you don't ignore them or suppress them, nor do you analyze or judge their content. Rather, you simply note any thoughts as they occur as best you can and observe them intentionally but nonjudgmentally, moment by moment, as the events in the field of your awareness."
For me, I have chosen to combine this "Zen" calmness, with the Robert Lichello automatic investing ideas, and the O'Neil CANSLIM observations on the "M" of the Market. In other words, I have chosen to listen to my own portfolio and observe the actions of the market and to respond to them without judgment and analysis but with understanding and appreciation.
Within my own portfolio, when stocks hit sale points that I have previously set to limit losses, this represents not only a sale of a poorly-performing holding but a 'message' to me that demands my attention. For all of us, stocks that end up being sold for poor performance or are behaving poorly without being sold are 'talking to us', telling us something about the state of the markets in general.
It is this observation, this mindfulness about my own portfolio, that has led me to set up my system of moving between 5 and 20 positions, setting my portfolio size in response to the actions of my own holdings rather than in anticipation of any market move which may or may not occur.
This system has worked well for me. I am currently at 6 positions, and shall wait for either a message of encouragement resulting from a sale at an appreciation target, and thus add a new position, or a message of discouragement, with a sale on a decline letting me know that things aren't well at all and instead I should be 'sitting on my hands.'
I don't know if this 'strategy' will work over the long haul. I am but an amateur investor after all. I do know that it seems to working now and I have been listening.
Maybe we all need to be listening more to our own holdings, the stock market, and the news that is occurring all around us. Instead of perhaps listening to the wide array of 'talking heads' that direct us to act on passions instead of mindfulness.
Yours in investing,
Bob
Thursday, 10 April 2008
Aeropostale (ARO) "Revisiting a Stock Pick"
Hello Friends! Thanks so much for stopping by and visiting my blog, Stock Picks Bob's Advice! As always, please remember that I am an amateur investor, so please remember to consult with your professional investment advisers prior to making any investment decisions based on information on this website.
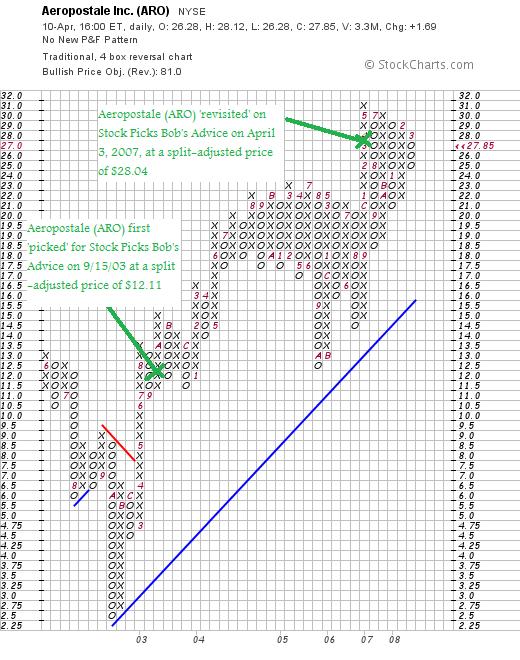
 I was looking through the list of top % gainers on the NYSE this afternoon and came across an 'old favorite' of mine acting quite well, in fact closing at $27.85, up $1.69 or 6.46% on the day. I do not own any shares nor do I have any options on this stock.
I say 'old friend' because this will be the third time that this Aeropostale has come to this blog's attention. I first posted ARO on Stock Picks Bob's Advice on September 15, 2003 when the stock was trading at $27.25. Adjusted for two 3:2 stock splits (April, 2004, and August, 2007), this works out to a pick price of $27.25 x 2/3 x 2/3 = $12.11. Thus, with the stock at $27.85, this represents an appreciation of $15.74 or 130% since posting.
One year ago, on April 3, 2007, I 'revisited' Aeropostale when the stock was trading at $42.06, which adjusted for the August, 2007, 3:2 stock split works out to a price of $28.04. Thus, since the post a year ago the stock has actually dipped a few cents to the current closing stock price of $27.85.
Let me share with you my observation on this stock as it is today and why
AEROPOSTALE (ARO) IS RATED A HOLD
What exactly do they do?
 According to the Yahoo "Profile" on Aeropostale (ARO), the company
"...designs, markets, and sells its own brand of merchandise principally targeting 14 to 17 year-old women and men, as well as provides lifestyle-oriented brands targeting 18 to 25 year-old women and men. It offers a collection of apparel, including graphic t-shirts, tops, bottoms, sweaters, jeans, outerwear, and accessories."
Is there any news on this stock?
Today is the first Thursday of the month. "What's so special about that?"...I can almost hear you asking. Well that is the day that the retailers announce their 'same store sales figures'.
Today a lot of retailers announced their figures on same-store sales. Many of the numbers were strikingly negative! Major retailers like Gap (GPS) announced negative (18)% comparables, Chicos (CHS) came in with a negative (20.7)%! American Eagle (AEO) figures dipped (12)%. Thus when Aeropostale (ARO) came in with a positive 2.5%, this was big news. Especially relative to the performance of many of the other specialty retailers. And the market rallied behind the stock.
What about the latest quarterly report?
On March 13, 2008, Aeropostale (ARO) posted 4th quarter 2007 results. Total net sales for the fourth quarter increased 16.7% to $591.3 million from $506.8 million in the same quarter in 2006. Same store sales for the quarter came in at a positive 9.2% over the prior year.
Net income for the quarter was $64.7 million or $.95/diluted share. Excluding special items, earnings for the quarter were actually $63.0 million or $.93/diluted share. This compares to $57.3 million or $.72/diluted share the prior year same period.
The company beat expectations on earnings as indicated by analysts polled by Thomson Financial who had expected net income of $.88/share. They also beat expectations on revenue coming in at $591.3 million while analysts had been expecting revenue of $584.5 million.
How about longer-term results?
Reviewing the Morningstar.com "5-Yr Restated" financials on Aeropostale (ARO) we can see that revenue growth is continuing to steadily improve from $700 million in 2004 to $1.6 billion in 2008. Earnings have likewise steadily increased from $.62/share in 2004 to $1.73/share in 2008. Outstanding shares are not only stable but have actually decreased from 87 million in 2004 to 75 million in 2008.
Free cash flow has been solidly positive if not steadily increasing with $86 million in 2006 and $89 million in free cash flow in 2008.
The balance sheet is adequate with $112 million in cash and $173 million in other current assets. This total of $285 million in current assets, when compared to the $197.4 million in current liabilities yields a current ratio of 1.44...an adequate ratio imho.
What about some valuation numbers?
Looking at the figures from Yahoo "Key Statistics" on Aeropostale, we can see that the company is a mid cap stock with a market capitalization of $1.86 billion.
The trailing p/e is reasonable imho at 16.14, and the forward p/e (fye 02-Feb-10) is estimated at 12.32, yielding a terrific PEG of 0.76.
According to the Fidelity.com eresearch website, the Price/Sales (TTM) ratio of 1.23 is a bit rich relative to the ratio of 0.84 which is the industry average. On a more positive note, Fidelity also reports that the Return on Equity (TTM) for ARO of 46.28% is significantly higher than the profitability figure of 23.29% reported to be the 'industry average'.
Returning to Yahoo, there are currently 66.74 million shares outstanding with 65.36 million that float. As of 3/11/08, there were 9.6 million shares reported out short representing 4.2 trading days of volume (the short ratio), or 14.6% of the float. This is a bit higher than my own '3 day rule' for short interest, but does not represent much of a 'squeeze' potential.
No dividend is reported by Yahoo, and as I already noted, the stock last split with a 3:2 stock split reported on August 22, 2007.
What does the chart look like?
Reviewing the 'point & figure' chart on Aeropostale (ARO) from StockCharts.com, we can see that since the price dipped to a $2.50 level in October, 2002, the price has actually fairly steadily appreciated to the recent high of $31 in May, 2007, not much higher than the current price of $27.85.
Summary: What do I think?
Well, I really like this stock. The valuation is reasonable with a p/e in the teens and a PEG well under 1.0. The Price/Sales is a tad steep but the return on equity is solid. The latest quarter was great and the last five years have shown steady growth with the company actually reducing its shares outstanding.
On a negative note, the entire retail environment is guarded with the economy seemingly heading into recession. Aeropostale did relatively well and is continuing to show growth, if rather reduced down to the low single digits.
With all of this in mind, the best I could do is to rate the stock a "hold".
Thanks so much for stopping by and visiting! If you have any comments or questions, please feel free to leave them right on the blog or email me at bobsadviceforstocks@lycos.com.
If you get a chance be sure and visit my Covestor Page where my actual trading account is monitored and this blog is reposted, my SocialPicks page where my many stock picks are also monitored, and my podcast page where I have recorded some various shows on some of the many stocks I have written up here on the website.
Wishing you all a wonderful Friday and a great week ahead!
Yours in investing,
Bob
Posted by bobsadviceforstocks at 11:11 PM CDT
|
Post Comment |
Permalink
Updated: Thursday, 10 April 2008 11:12 PM CDT
Tuesday, 8 April 2008
A Reader Writes "Sirius and XM combined...I truly disagree with your analysis on this issue."
Hello Friends! Thanks so much for stopping by and visiting my blog, Stock Picks Bob's Advice! As always, please remember that I am an amateur investor so please remember to consult with your professional investment advisers prior to making any investment decisions based on information on this website.
 I had a nice letter this afternoon (already) from one of my loyal readers, 'Gleb from Brooklyn' who has written before and has been following along with my entries. (If you have any comments or questions, please feel free to leave them on the blog or email me at bobsadviceforstocks@lycos.com). He didn't, however, agree with my assessment on the monopolistic tendencies of the proposed and recently approved XM-Sirius merger. Gleb wrote:
"Hi Bob,
As you know, I am a big fan of your blog and the podcasts.
However, I truly disagree with your analysis on this issue. I believe that Sirius and XM combined do not form any sort of monopoly within the radio industry for several reasons. The first reason is that the services from these companies are very expensive - especially compared with the alternative of regular radio. Also, HD radio is being advertised all over the place, however I am not sure about the long term prospects of the technology. In addition, since these companies were created, there has been a very serious technological revolution in the music space. As you mentioned, Apple has become a dominant player in the music industry with Ipod/Itunes/Podcasts which lowers the number of people that rely on Satellite Radio.
Besides the argument that there would not be a monopoly, I think the merger will benefit the users of Sirius and XM alike once the technology issues are ironed out. I know several people who have complained that they do not have access to sports broadcasts for all sports due to exclusive deals. A merged company would allow listeners to enjoy Stern & Oprah and sports programming through one service. In addition, I believe that the CEO for Sirius has talked about offering a la carte service which would let listeners choose what stations they want to subscribe to giving a better bang for your buck.
A big fan,
Gleb from Brooklyn, NY"
Thank you so much for writing! And for entering into this discussion. You obviously are not alone as the Department of Justice also weighed in on this and decided it wasn't a monopoly.
Let me think about your arguments.
You write first that it isn't a monopoly because "the services from these companies are very expensive---especially compared with the alternative of regular radio."
O.K. you lost me. The issue of a monopoly isn't whether the services are expensive or not. The point is that the combined services would no longer have any competition in providing this satellite service (they each are competitors with the other) and thus there would be even less incentive for them to keep the prices down.
What about HD radio? I don't know much about HD. This might possibly make satellite obsolete. But this isn't really the point. The question is whether in the market service called "satellite radio" there is adequate competition. The reason that Congress (I believe it was them or the FCC) set up two providers was simply so that there wouldn't be a monopoly.
Satellite radio is a system all to itself. When I am listening to my XM radio (which I absolutely adore), I do not listen to Sirius or even to conventional radio as competition. I can indeed flip back to FM or AM on my radio, but the service that I purchase is a choice between XM and Sirius when I purchased my unit from Best Buy. Once they merge, there will no longer be choice in satellite services.
We could just as easily justify the elimination of all the different cable providers and simply say that Time Warner should own every cable company in the United States. Saying that there was competition for watching television by using DVD's or broadcast TV would not really deny the argument that a single cable provider EVERYWHERE was a monopoly.
Finally, the question of Apple providing music with iPods, iTunes, etc., really begs the question. This is not a question of the ability to listen to music from other sources besides satellite. The question is whether satellite radio is a distinct service and whether combining the only two providers sets up a de facto MONOPOLY. I cannot avoid that obvious conclusion.
You might ask whether the consumer is better off because there will be more options and sports for all of the satellite subscribers. You might have a point at least for now.
But if there is a monopoly created, as I assert that it is without a doubt, what would be the incentive for new programming to be offered to consumers? There wouldn't be competition from the 'other' provider.
What would be the incentive to keep prices down? The only incentive right now for this a la carte talk is the possibility that the merger is denied.
The least responsive provider of a service is one in which the audience is essentially captive, with no alternative service to be chosen. Why should they even answer the phone when you call?
Anyhow, that's my take. I appreciate very much your input and the time you took to respond. Like I said in my entry, I very much like satellite radio and am an early subscriber to XM.
It is just that I really appreciate the Free Market system that we all enjoy, and occasionally, it seems that it may well be necessary to break up or prevent mergers that are simply anti-competitive.
Our Department of Justice really seems to have failed us this time.
BTW, I do NOT own any shares of either of these companies nor do I have any options on their shares.
Bob
Posted by bobsadviceforstocks at 9:25 PM CDT
|
Post Comment |
Permalink
Updated: Tuesday, 8 April 2008 9:26 PM CDT
Is the Sirius-XM Merger forming a Monopoly?
I love my XM radio.
 Most of the time I listen to CNBC getting the latest Stock Market information while driving along in my car. But I also like the wide range of music choices; I enjoy channel 28 which is the Broadway Tunes channel. When my daughters get in the car, they are switching over to current hits. The choices are terrific. I plug the service to all of my friends.
But is the proposed merger between XM and Sirius anti-competitive and somehow forming a monopoly?
The Department of Justice didn't think so.
As reported:
"Our data confirms that there was very little switching between companies after a person subscribes to a particular service," said Assistant Attorney General Thomas Barnett during a conference call with reporters Monday afternoon. "
As the same article summarized:
"Despite cries from some politicians and traditional broadcast companies calling the pending deal harmful to consumers, the Department of Justice determined that an XM-Sirius merger was not anti-competitive. The Justice Department argued that other media companies such as Clear Channel (CCU, Fortune 500), CBS (CBS, Fortune 500), or even Apple (AAPL, Fortune 500) with its iTunes software and iPod music player served as alternate options for music and media customers."
Oh really?
 I know that my favorite commentator Jim Cramer had been plugging away for the merger. He has argued:
"- The combined company would have more offerings and pricing plans that have clear benefits for the consumer, which is precisely what the FCC is looking for.
- It’s just not an antitrust violation. Satellite radio makes up less than 5% of all radio, and neither XM nor Sirius is profitable. What sort of monopoly would that be?
- Current market conditions are so bad that it would be hard for the Feds to turn away this merger, especially given all the negativity and the huge decline in M&A."
So what exactly is a Monopoly under the Sherman Act?
Not being a lawyer, I found this opinion online:
"A monopoly power is defined as the ability of a business to control a price within its relevant product market or its geographic market or to exclude a competitor from doing business within its relevant product market or geographic market. It is only necessary to prove the business had the "power" to raise prices or exclude competitors. The plaintiff does not need to prove that prices were actually raised or that competitors were actually excluded from the market.
Today, a general definition of a monopoly is where nearly all of one product type or service is owned by one person or group of people within a community or area. Thereby, the sole control of this product or service is given to one party to the elimination of all others within the marketplace. To determine whether purchasing a competitor's business or creating an agreement with a competitor may result in a monopoly within your market place, please seek the advice of an attorney."
I found this comment from a longer article from the Department of Justice in 2003 before this merger was proposed:
"The ultimate inquiry in any merger review is whether the proposed merger will affect the state of competition: why does this merger matter? Under a coordinated effects analysis, that inquiry focuses on whether, post-merger, suppliers will have a greater incentive and ability to coordinate. That is, will the merger make coordination more likely, more perfect, more complete, or more durable? A merger could make coordination more likely simply by reducing the number of players needed for consensus or by removing an industry "maverick" with a history of undercutting or resistance to market leadership. A merger could make coordination more perfect by creating a price leader or by enabling the now fewer number of firms to support a higher price or otherwise more stringent terms of coordination. In much the same way, a merger could make coordination more complete by, for example, extending the duration, product coverage, or geographical reach of coordination. Finally, a merger could make coordination more durable by enabling firms to better monitor compliance."
Excuse me for diving into this one. But if each of these companies were so great, wouldn't they also be able to be acquired by a larger media firm that might maintain competition by strengthened financials while these satellite firms matured and became profitable?
 And are we rewarding mismanagement that would award Howard Stern a $500 million deal while barely staying afloat financially?
As I recall, the initial license for two providers of satellite services was designed to provide the minimum for some sort of competition.
How is just one provider really protecting the basic capitalist idea of competition in this service? How does one satellite provider offer a consumer or an automobile manufacturer any incentive at negotiating for a better deal, better service, or more innovation?
Excuse me for asking, but I just don't get it.
Yours in investing,
Bob
Sunday, 6 April 2008
"Trading Portfolio Update" April 6, 2008
Hello Friends! Thanks so much for stopping by and visiting my blog, Stock Picks Bob's Advice! As always, please remember that I am an amateur investor, so please remember to consult with your professional investment advisers prior to making any investment decisions based on information on this website.
There are many different things I am trying to accomplish on this website simultaneously. First of all, I like to discuss and refine my own investment strategy. Next I discuss many stocks that I consider 'investable'--stocks that meet my own criteria of consistent revenue growth, earnings growth, stable outstanding shares, free cash growth, good balance sheet, reasonable valuation and a solid latest quarterly report.
At the same time, I am also providing all of you with an inside look at this particular amateur investor's actual trading account. O.K. that isn't such a big deal :), but I am still working at providing all of you with transparency. That is, when I buy or sell stock, I post it here and provide all of you with the rationale. Except for my occasional 'trades' that I am avoiding as much as possible, this keeps me honest. This provides me with a reason to continue to abide by the 'rules' that I have set up for myself. And insofar as this process continues to be thankful, I thank all of you for your participation on this website.
About once per month I have been updating my actual 'trading portfolio'. You can now verify what I write on Covestor by visiting my Covestor Page where that website also tracks my trading, holding and performance. Their performance figures, however, are as of when I signed up for Covestor. The numbers I share with you are for my performance with each of these holdings since purchase. (If any of you would like an 'invitation' to joing Covestor, which I am not sure is absolutely needed to get an account, I do have four more invitations in my name---just email me and I will email it back to you!)
Well back to work. I last reviewed my trading portfolio back on February 26, 2008. This review is as of today, April 6, 2008. The holdings are listed in alphabetic order of their symbols, followed by the number of shares, date of purchase, price of purchase (cost basis), latest price (4/4/08), and percentage unrealized gain or (unrealized loss).
Copart (CPRT), 210 shares, 9/27/07, $33.73, $41.31, 22.48%
Covance (CVD), 102 shares, 4/9/07, $62.61, $86.28, 37.80%
IHS Inc. (IHS), 140 shares, 10/1/07, $58.53, $62.34, 6.51%
Morningstar (MORN), 103 shares, 11/22/05, $32.57, $65.13, 99.94%
ResMed (RMD), 150 shares, 2/4/05, $29.87, $45.16, 51.20%
Meridian Bioscience (VIVO), 171 shares, 4/21/05, $7.42, $34.74, $368.26%
Currently I am down to six positions. As you may recall, I have a minimum of 5 positions in my 'strategy' going to a maximum of 20. The current market value of securities if $45,626.19 with $110.68 in the money market portion of the account.
As of April 5, 2008, I had $(1,250.59) in total realized losses in 2008 made up of $(4,534.09) in short-term losses, and $3,283.50 in long-term realized gains. In 2008 I have had $29.63 in total income and $(221.13) in margin interest paid.
The relative decrease in cash and the performance in this account is related to the unfortunate 'trade' in Lehman Bros which I tried to do a 'trade' outside of my regular 'rules'. I continue to learn.
I shall be waiting for either a sale if stocks decline, bringing me down to my minimum of 5 positions, or a sale on appreciation should my stocks move higher, in which case I shall be once again looking to add another position!
Thanks so much for once again visiting here! If you have any comments or questions, please feel free to leave them on the blog or email me at bobsadviceforstocks@lycos.com.
Yours in investing,
Bob
Posted by bobsadviceforstocks at 10:05 PM CDT
|
Post Comment |
Permalink
Updated: Sunday, 6 April 2008 10:06 PM CDT
"Looking Back One Year" A review of stock picks from the week of September 18, 2006
Hello Friends! Thanks so much for stopping by and visiting my blog, Stock Picks Bob's Advice! As always, please remember that I am an amateur investor, so please remember to consult with your professional investment advisers prior to making any investment decisions based on information on this website.
It is now Sunday evening, and I really want to get this review out before the weekend is over. I have missed a few weeekends along the way and the result is that the 'year ago' period is more like a year-and-a-half....and it might even close on two years out!
Anyhow, these reviews are based on a presumed buy and hold strategy. In practice I advocate and employ a disciplined investment strategy. The difference between these two approaches would certainly affect performance and should be taken into consideration.
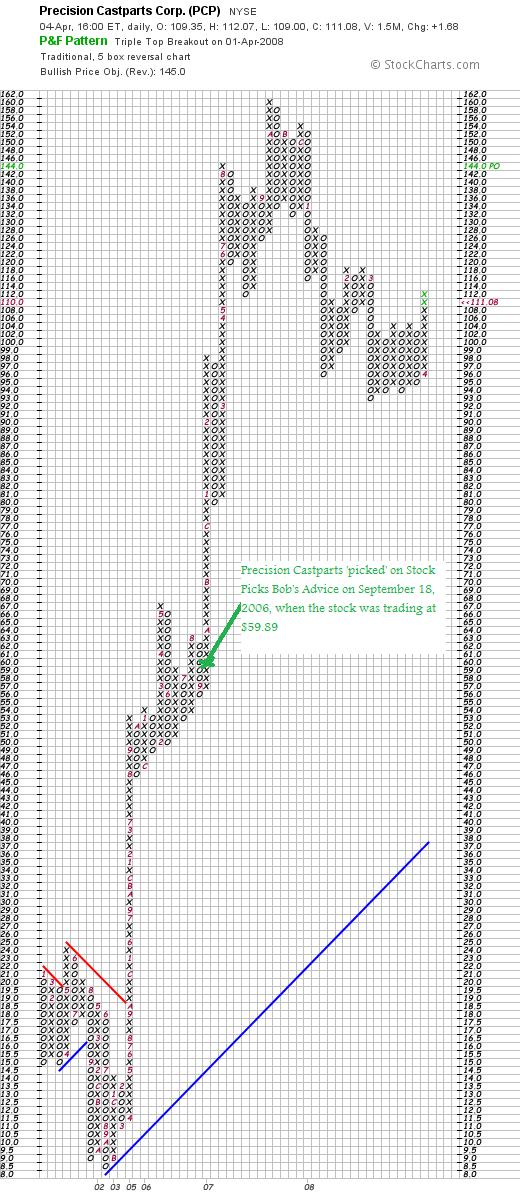
 On September 18, 2006, I posted Precision Castparts (PCP) on Stock Picks Bob's Advice when the stock was trading at $59.89. I purchased some shares later for my own account and later sold it on a decline. I do not own any shares of PCP at this time. Let's take another look at this stock and I shall explain why
PRECISION CASTPARTS (PCP) IS RATED A BUY
PCP closed at $111.08 on April 4, 2008, for a gain of $51.19 or 85.5% since posting.
On January 22, 2008, Precision Castparts (PCP) announced 3rd quarter 2008 results. Sales increased 22.7% to $1.70 billion from $1.38 billion the prior year same period. Net income came in at $246.5 million, up from $158.7 million the prior year. This was $1.78/share this year vs. $1.17/share last year.
The company came in a little light on revenue, but beat expectations on earnings according to analysts polled by Thomson Financial who on average had been expecting earnings of $1.72 on sales of $1.74 billion.
The Morningstar.com "5-Yr Restated" financials on PCP are intact with solid revenue growth, earnings growth, stable outstanding shares, free cash flow growth, and a solid balance sheet.
If we review the recent StockCharts.com 'point & figure' chart on Precision Castparts, we can see how the stock has recently been under pressure (as have most all stocks), but that how the stock price hasn't fundamentally broken down long-term.

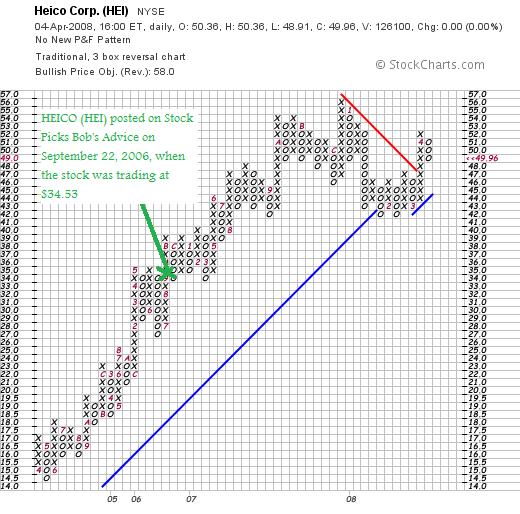
On September 22, 2006, I posted HEICO (HEI) on Stock Picks Bob's Advice when the stock was trading at $34.53. I do not own any shares nor any options on this stock. However, I would like to share with you why I believe
HEICO (HEI) IS RATED A BUY
HEICO closed at $49.96 on April 4, 2008, for a gain of $15.43 or 44.7% since posting.
On February 28, 2008, HEICO reported 1st quarter 2008 results. Net sales increased 18% to $134.3 million from $113.7 million the prior year same period. Net income grew 27% to $10.1 million or $.37/diluted share from $7.9 milion or $.30/diluted share last year.
The Morningstar.com "5-Yr Restated" financials page is intact with continuing steady revenue growth, earnings growth, dividend growth, stable outstanding shares, free cash flow growth, and a solid balance sheet.
Reviewing the StockCharts.com 'point & figure' chart on HEICO (HEI), we can see that the stock price, which did come under pressure this year, has been acting stronger, breaking through recent price resistance and overall has held up quite well from my perspective.
Actually I did quite well with these two stock picks. These selections had an average appreciation of 65.1% since being selected for this website.
Thanks again for visiting! If you have any comments or questions, please feel free to leave them on the blog or email me at bobsadviceforstocks@lycos.com. If you get a chance, be sure and visit my Covestor Page where my actual trading portfolio is monitored, my SocialPicks Page where my many stock picks are being tracked, and my Podcast Page where you can download some 'radio shows' I have done explaining some of the stocks and ideas I share with all of you on this website.
Have a great week ahead everyone!
Yours in investing,
Bob
A Reader Writes: "I was hoping you could answer a few questions...."
Hello Friends! Thanks so much for stopping by and visiting my blog, Stock Picks Bob's Advice! As always, please remember that I am an amateur investor, so please remember to consult with your professional investment advisers prior to making any investment decisions based on information on this website.
One of my favorite tasks on this blog is to answer questions and comments from readers who have obviously given them a lot of thought. If you would like to reach me, feel free to drop me a line at bobsadviceforstocks@lycos.com. I read all of my emails but unfortunately cannot answer each one. I received a great comment from Erik C. who wrote:
"Hello Bob,
I was hoping you could answer a few questions I've had lingering on my mind for the past couple months. But before I do that, thank you for your response regarding the state of the US dollar. You went beyond my expectations, the amount of thought you put into your response was greatly appreciated.
When I started investing, I decided to stick to the Warren Buffet school because hey, you need to start somewhere right? I've been examining my portfolio and calculating my gains if I were to adopt a style closer to your own and it would have resulted in noticeably larger gains. I believe one of the contributing factors is because some of my holdings appreciated extremely quickly and as a result made them too p/e rich for me. As a result, I am considering adopting a small portion of my portfolio to a style similar to yours as an experiment.
My understanding of your investment style is to purchase on good news and a sale on bad news leaves you sitting on your hands. Is this to invest when momentum is on your side; to be a bull when your holdings are bullish and vice versa? The market has been up a fair bit the past week, if you reach a sale on appreciation, would you purchase more to capture more gains in the temporary bullish run up when another detrimental bombshell could easily hit at anytime? Are you willing to be a bull if your portfolio is bullish even though the market has a whole is bearish?
Last year during the beginning of the subprime mess, you lamented being whipsawed over a couple trades (Sorry, I had a great deal of difficulty finding the appropriate entries or I would cite them for reference). How did lessons learned during previous unstable markets affect your current "Buy Signal" indicator? Does the risk of being whipsawed affect your style now that we are deep in an extremely volatile market?
Finally, forgive me if this is incorrect, I am not a resident of the United States and I'm not completely familiar with your tax laws. I am under the belief that capital gains on stock held for less than a year are taxed considerably higher. How do you structure your portfolio around this? When I did the math on my portfolio, if I were to adopt your strategy from when I started to present, I would be up more money post tax. How has taxes affected the decision to adopt a more active strategy versus buy and hold?
As always thanks for reading, your thoughts are always appreciated
PS before sending this, I briefly checked your past entries looking for literature on how you deal with a bear market and found an old post reiterating your trading strategy. I waffled between editing my questions with that post in mind, but ultimately felt that I was asking questions that have not been asked. My apologies in advance if they already have been answered, your blog has a lot of content and you can only sift through so much before giving up."
Erik thanks so much for writing once again! Your comments are more than generous towards my website.

You started out talking about Warren Buffett a brilliant investor who really is in a class all by himself.
Mr. Buffett is the most well-known 'value investor' and also likely the most successful.
As this article from Investopedia explains:
"Warren Buffett descends from the Benjamin Graham school of value investing. Value investors look for securities with prices that are unjustifiably low based on their intrinsic worth. When discussing stocks, determining intrinsic value can be a bit tricky as there is no universally accepted way to obtain this figure. Most often intrinsic worth is estimated by analyzing a company's fundamentals. Like bargain hunters, value investors seek products that are beneficial and of high quality but underpriced. In other words, the value investor searches for stocks that he or she believes are undervalued by the market. Like the bargain hunter, the value investor tries to find those items that are valuable but not recognized as such by the majority of other buyers.
Warren Buffett takes this value investing approach to another level. Many value investors aren't supporters of the efficient market hypothesis, but they do trust that the market will eventually start to favor those quality stocks that were, for a time, undervalued. Buffett, however, doesn't think in these terms. He isn't concerned with the supply and demand intricacies of the stock market. In fact, he's not really concerned with the activities of the stock market at all. This is the implication this paraphrase of his famous quote : "In the short term the market is a popularity contest; in the long term it is a weighing machine."
But that isn't what I do. It isn't a bad approach, but I have chosen to pay attention to the 'activities of the stock market'. In fact, the market's activities virtually controls my own direction and decision-making.
You write about my strategy regarding buying stocks on 'good news' and selling on 'bad news'. Actually the difference between what I do and your observation is subtle. I sell stocks either on their reaching appreciation targets (I use 30, 60, 90, 120, 180, 240, 300 360, 450, 540%....etc.) at which time I currently sell 1/7th of a holding. Or I sell on a decline of 8% after an initial purchase, back to break-even if I have sold a holding once at a 30% gain, or if it should decline to 1/2 of its highest appreciation-point-sale. In those cases I sell the entire position. The last sale-point might be explained by noting if I happened to own Stock "XYZ" and had sold it four times (at 30, 60, 90 and 120% appreciation levels), then I would sell the entire position if it declined to 1/2 of the highest sale point or at a 60% appreciation level.
In addition to all of that I do reserve the right to 'bail-out' of a stock on actual bad news. Sort of like a criminal investigation or some horrible earnings report or other development. I have also retained the right to purchase stocks 'for a trade' but am trying to suppress that activity entirely as it hasn't been very successful for me.
But getting back to your comment, when I sell a stock at an appreciation point, I call that "good news" and use it to as a signal on the entire market environment. Thus, I give myself permission, if I am under my maximum number of positions, which currently I have placed at 20 (I am actually at 6 positions as I write), to add a new holding to my portfolio.
In the same way, sales on declines aren't based necessarily on any particular 'bad news', (except in the aforementioned arbitrary right that I reserve to sell on such events), but rather are declines in stock prices that trigger sales simply based on reaching price levels on the downside. I refer to these sales as "bad news" and you are correct, I 'sit on my hands' with the proceeds.
Again, your question: "Is this to invest when momentum is on your side?"....is actually on the mark.
I am trying to remove my own emotional input into the decision of 'when' to be buying stock from the equation. I am assuming that my own portfolio is somewhat of a reflection of the entire investment world. (It is certainly a stretch, but I think it works!). Thus when one of my own stocks hits a sale on good news, I am using this as a signal to add a new positions. Likewise, on the downside, I am using this as a signal not to be investing.
You ask about the short-term appreciation of the stock market, and whether if I reached a sale on appreciation I would be buying. The answer is 'Yes!'. But you will also note that my portfolio of six stocks hasn't reached any sale this week and doesn't appear to be very close.
So I am willing to be a bull when the rest of the market is bearish. I am deferring to my own stocks to dictate to me. I suspect my own holdings will act more rationally than I will as the market swings from optimistic upward moves to sharp declines.
You also asked about some whipsawing that happened in my own account and what I might have learned. Basically, the biggest problem I have had in my account is related to my impulsive trades that shouldn't have been done at all. My overall strategy is working fine. I have been performing several points ahead of the S&P since Covestor started tracking me, and would be doing even better if I had avoided the 'trades', large positions that I tried to trade on the sharp moves in the market.
The volatility in the market has firmed my resolve at following my own investment strategy.
The tax question is a good one. Indeed we have taxes to pay when short-term gains are recorded that are a higher rate than long-term gains.
As this article explains:
"Your tax will depend on a few things. If you have a short term capital gain you will be taxed at your normal tax rate. However, if you have a long term gain you will be taxed at 15%. If you are in a tax bracket of 14% or less you'll be taxed at 5%.
How do I know if I have a short term or long term gain? To determine whether you have a long or short term capital gain is quite simple. Property that you own for less than one year is defined as short term. Property that you own for more than one year is defined as long term."
So you are correct that it would be wiser, taxwise, to hold stocks for longer periods rather than selling. However, losses can be used to reduce gains....
"If you lost money on a capital asset it can be deducted on your taxes. Money that you lost on an investment is used first against profits you've made on another investment. Short term and long term capital losses can both be deducted but there are certain rules for each type of capital gain.'
And you will recall that my trading strategy involves taking losses aggressively. Hopefully, I shall have many more gains than losses both short-term and long-term. I am prepared to pay taxes to guarantee my long-term success.
Thanks for looking through the blog for some of these answers. I am more than happy to write up this response from a very well-thought-out reader! Thank you for loyally dropping by and thank you for taking the time to write!
Again, if you or any other readers have questions, please feel free to leave them on the blog or email me at bobsadviceforstocks@lycos.com. If you get a chance, be sure and visit my Covestor Page where my actual trading portfolio is monitored, my SocialPicks page where many of my stock discussions this past year are reviewed, and my Podcast Page where you can download mp3's of discussions of many of the same stocks discussed on the blog!
Yours in investing,
Bob
Wednesday, 2 April 2008
Immucor (BLUD) "Revisiting a Stock Pick"
Hello Friends! Thanks so much for stopping by and visiting my blog, Stock Picks Bob's Advice! As always, please remember that I am an amateur investor, so please remember to consult with your professional investment advisers prior to making any investment decisions based on information on this website.
 With the market acting a little more reasonable today, I wanted to find a stock that fit my criteria that I could share with all of you. Going to my usual 'first step' in identifying stocks, I noted that Immucor (BLUD) had made the list of top % gainers on the Nasdaq today, where it is currently trading at $25.78, up $2.17 or 9.19% on the day. I do not own any shares of Immucor nor do I have any options.
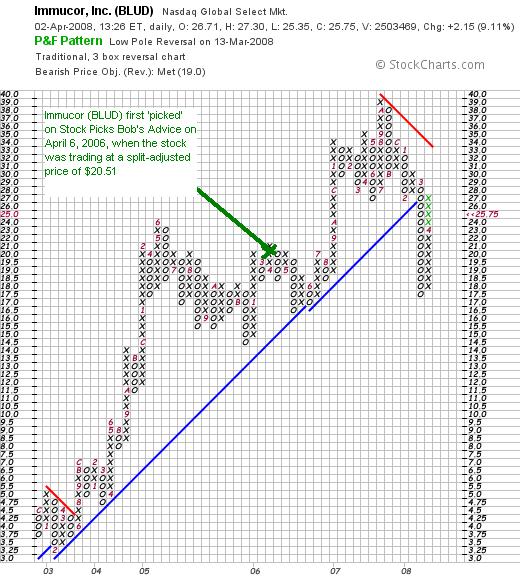
I use the term "revisit" on this entry because Immucor is what I like to call an 'old favorite' of mine, having reviewed it previously on Stock Picks Bob's Advice on April 6, 2006, almost two years ago. At that time the stock was trading at $30.76/share. However, Immucor split its stock 3:2 on May 16, 2006, making the effective pick price actually $20.51. Thus, with the stock trading currently at $25.78, this represents an appreciation of $5.27 or 25.7% since the stock was first discussed on this blog.
Let's take a closer look at this stock once again and I will share with you why I have decided
IMMUCOR (BLUD) IS RATED A BUY
First of all,
What exactly does this company do?
 According to the Yahoo "Profile" on BLUD, the company
"...together with its subsidiaries, develops, manufactures, and sells a range of reagents and automated systems. Its products are used primarily by hospitals, clinical laboratories, and blood banks in various tests performed to detect and identify certain properties of the cell and serum components of human blood prior to blood transfusion."
How did they do in the latest quarter?
As is often the case on this blog, Immucor just announced 3rd quarter 2008 earnings yesterday after the close of trading, and it was this announcement that pushed the stock higher in trading today!
For the quarter ended February 29, 2008, revenue came in at $67.0 million, up 17% from 57.1 million during the same period last year. Net income for the quarter was $19.3 million, up 28% from the $15.0 million in the same quarter a year earlier. This worked out to $.27/share this year vs. $.21/share last year.
From my perspective these were solid results. But more important than earnings to a stock performance is what the expectations were on these results, and how the company did relative to these expectations. In fact, the company beat expectations in the quarter with net income of $.27/share when analysts polled by Thomson Financial were expecting $.22/share.
What about longer-term results?
If we review the Morningstar.com "5-Yr Restated" financials page on BLUD, we can see that the company has done a superb job with its underlying fundamentals, with revenue growing from $99 million in 2003 to $224 million in 2007 and $244 million in the trailing twelve months (TTM). During this time earnings have increased from $.28/share (except for a dip to $.18/share from $.28/share beetween 2003 and 2004), to $.85/share in 2007 and $.95/share in the TTM. No dividends are paid.
Outstanding shares have been stable at 64 million in 2003, increasing only to 68 million in the TTM.
Free cash flow has been positive and essentially growing from $35 million in 2005 to $55 million in the TTM. The balance sheet is solid with $138 million in cash which by itself can easily cover both the current liabilities of $43.1 million and the long-term liabilities of $15.7 million combined. Calculating for the current ratio, the total current assets of $238 million, divided by the current liabilities of $43.1 million yields a figure of 5.52, well above the level of 2.0 considered by some to be an indication of financial health.
What about some other valuation numbers?
Looking at Yahoo "Key Statistics", we can see that the company has a market capitalization of $1.8 billion, still considered a 'small cap stock' since it is under the $2 billion level.
The trailing p/e works out to 27.26 with a forward p/e (fye 31-May-09) estimated at 27.70. However, this doesn't quite jive with the PEG of 1.03 (5 yr estimated) which suggests that earnings ought to be estimated at growing at a 25% rate.
Checking the Fidelity.com eresearch website, we find that valuation is a tad rich as measured by the Price/Sales (TTM) ratio which for BLUD works out to a level of 6.72 relative to an industry average of 5.85. In terms of profitability, Fidelity calculates the Return on Equity (TTM) at a level of 29.27%, ahead of the industry average of 20.46%.
Finishing up with Yahoo, there are 69.97 million shares outstanding with 68.92 million that float. Currently, as of 2/26/08, there were 8.41 million shares out short yielding a short ratio of 10.8 or 12.2% of the float. I have been using my own idiosyncratic cut-off of these ratios of 3 days suggesting that this is quite a load of shares out short which might expain today's rise in stock price if the stock was subject to a short squeeze.
As I noted above, no dividend is paid and the last stock split was on May 16, 2006, when the stock split 3:2.
What does the chart look like?
Of all of the measures of this stock, the appearance of the "point & figure" chart from StockCharts.com gives me the greatest pause. We can see a beautiful run for this stock from a low of $3.25 in February, 2003, to a peak of $39 in October, 2007. However, since March, 2008, the stock broke through support at $28, dipped to a low of $17.50, and is fighting back to prior support levels. I would like to see the stock trading above $34 before I would be ready to give this stock an 'all clear'!
Summary: What do I think about this stock?
Needless to say, I like this stock a lot. I think it is likely to be recession-resistant in the medical technology field. They reported great earnings that beat expectations and have been steadily reporting terrific financial results for the past five years at least! Valuation is reasonable with a p/e in the 20's and a PEG just over 1.0. Price to Sales was a bit rich on analysis, but the Return on Equity suggests solid profitability. Their balance sheet is superb, and with a lot of shares out short there could well be a few short-sellers scrambling to buy shares if the stock rise continues!
Now, if I only had a signal to be buying stock!
Thanks again for visiting my blog! If you have any comments or questions, please feel free to leave them on the website or email me at bobsadviceforstocks@lycos.com. If you get a chance, be sure and visit my Covestor Page where my actual trading account is reviewed, my SocialPicks Page where you can review my past year's stock picks and their performance subsequently, and my Podcast Page where you can download some mp3's on many of the same stocks I discuss here on the blog!
Have a great week!
Yours in investing,
Bob
Saturday, 29 March 2008
"Looking Back One Year" A review of stock picks from the week of September 11, 2006
Hello Friends! Thanks so much for stopping by and visiting my blog, Stock Picks Bob's Advice! As always, please remember that I am an amateur investor, so please remember to consult with your professional investment advisers prior to making any investment decisions based on information on this website.
It has been a quiet week around these parts. I haven't found many stocks to write up and it is once again the weekend and time for a review! Last week I took a look at the week of September 4, 2006. Going a week ahead, let's review the picks from the week of September 11, 2006, which was a bit busier in regards to posting than some other weeks.
Needless to remind you, these reviews assume a "buy and hold" strategy of investing in which equal dollar amounts are purchased in each of these picks from the week and held without regard to price movement. In fact, I advocate and employ a disciplined investment strategy that requires me (except when I have rashly tried to do a 'trade'), to buy stocks only when I have a market signal o buy stocks, to sell stocks on declines, and to lock in appreciating stocks by partial sales at appreciation targets. Thus, the difference between this approach and a 'buy and hold' strategy would certainly be different....not necessarily better!
But, as I have commented elsewhere, it is easier to evaluate my picks assuming a simple purchase and hold than to evaluate it otherwise. Please do take that into consideration.
I should also like to be brief this afternoon/evening as I have a 'lot of things on my plate' this weekend but did want to get around to writing up a bit on the stocks I covered last year.
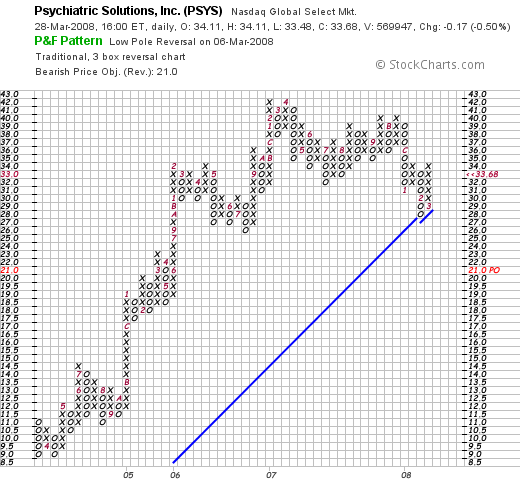
 On September 12, 2006, I posted Psychiatric Solutions (PSYS) on Stock Picks Bob's Advice when the stock was trading at $35.78. PSYS closed at $33.68 on March 28, 2008, for a loss of $(2.10) or (5.9)% since posting. I do not own any shares or options of Psychiatric Solutions.
PSYCHIATRIC SOLUTIONS (PSYS) IS RATED A BUY
On February 20, 2008, PSYS reported 4th quarter 2007 results. Revenue for the quarter increased 44.1% to $403.4 million, from $279.9 million the prior year same period. Net income increased to $23.2 million or $.42/diluted share, up from $17.6 million or $.32/diluted share the prior year. The company raised guidance for the 2008 fiscal year by $.10/share to $1.93 to $1.97/share reflecting the benefit of lower interest rates.
Analysts polled by Thomson Financial had been expecting 2008 results of $1.88/share. However, first quarter 2008 guidance of $.42 to $.43/share was below expectations of $.44/share. The announcement was 'mixed' because the company was reducing guidance over the short-term, but raising guidance for the full year. Within the same announcement, they optimistically estimated same-store sales figures (which for them means same-facility revenue numbers) to grow at a 7-8% rate in 2008 compared to the strong 6.5% increase reported in 2007.
Reviewing the Morningstar.com "5-Yr Restated" financials, we can see that the revenue growth is intact, earnings growth has not been interrupted, total shares while being slightly more than doubled between 2003 and 2007, have increased while revenue is up six-fold, and earnings are up six-fold as well.
Free cash flow is positive and the balance sheet appears adequate with $340 million in total current assets compared to $182.2 million in current liabilities. The company does carry a significant $1.2 billion in long-term liabilities which apparently is being managed adequately but should be noted.
Finally, looking at a 'point & figure' chart on PSYS from StockCharts.com, we can see that while under a bit of selling pressure recently (what stock isn't?), the chart actually appears to be holding up under the recent preessure and hasn't broken down from its long-term bullish move from early 2004 when the stock was selling at as low as $9/share to the high of $42 in April, 2007.
 Next that week, on September 13, 2006, I 'picked' Global Payments (GPN) for Stock Picks at a price of $41.25. GPN closed at $40.81 on March 28, 2008, for a loss of $(.44) or (1.1)% since posting. I do not own any shares or options of Global Payments.
Just the other day, on March 27, 2008, Global Payments (GPN) announced 3rd quarter 2008 results. For the quarter ended February 29, 2008, revenue climbed 19% to $310.6 million from $260.4 million the prior year. Diluted earnings per share (excluding a one-time favorable gain) increased 5% to $.44 compared to $.42/share last year during the same period.
GPN beat expectations of analysts polled by Thomson Financial who had expected earnings of $.42/share on revenue of $300.9 million. In addition, the company raised guidance for 2008--now expecting profits of $1.95 to $1.97, up from prior January guidance of $1.89 to $.96. In addition, the range of revenue expectations for fiscal 2008 was increased to $1.25 to $1.26 billion from prior January guidance of $1.23 to $1.26 billion.
Reviewing the Morningstar.com '5-Yr Restated' financials page, we can see a beautiful picture that remains intact of steadily increasing revenue from $516 million in 2003 to $1.06 billion in 2007 and $1.16 billion in the trailing twelve months (TTM). Earnings have increased from $.70/share in 2003 to $1.75/share in 2007 and $1.84/share in the TTM. The company does pay a dividend but has kept it at $.08/share during this same period. Total shares have climbed less than 10% during this time, from 75 million in 2003 to 78 million in 2007 and 81 million in the TTM. This less than 10% share dilution occurred during the same period that revenue increased more than 100% and earnings also climbed more than 100%.
Free cash flow is solidly positive although not particularly increasing between 2005 and the present. And the balance sheet is gorgeous with $363 million in cash which by itself can easily cover both the $189.1 million in current liabilities and the $109.9 million in long-term liabilities combined. With over $500 million in total current assets, the current ratio works out to a healthy 2.70.
Reviewing the 'point & figure' chart on Global Payments (GPN) from StockCharts.com, we can see that the stock while under pressure recently has neither broken down nor 'broken out' in its price performance. Instead it has been trading in a narrower and narrower range, most recently appearing to be ready to break-out on the upside. (Or is that wishful thinking?) In any case, it certainly doesn't appear to be over-extended, nor convincingly in a decline.
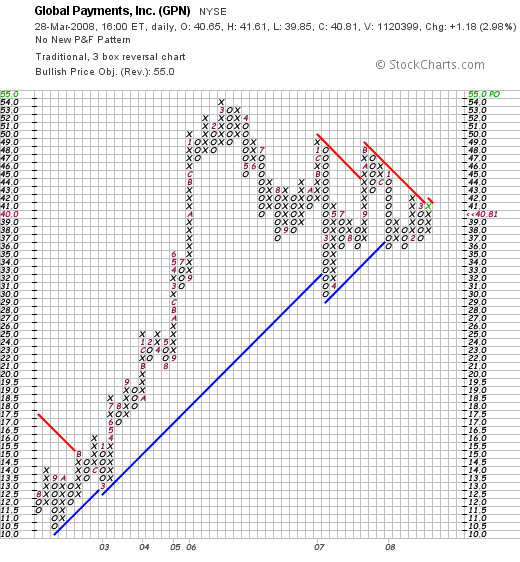
GLOBAL PAYMENTS (GPN) IS RATED A BUY
 The next stock I 'picked' on the blog didn't fare as well as the previous two.
NeuroMetrix (NURO) was selected for Stock Picks Bob's Advice on September 14, 2006, when the stock was trading at $20.50. I do not own any shares nor any options of this stock. NURO closed at $1.92 on March 28, 2008, for a loss of $(18.58) or (90.6)% since posting.
On February 12, 2008, NURO reported 4th quarter 2007 results. For the quarter ended December 31, 2007, revenue came in at $10.1 million, down from $14.2 million during the same period last year. They also reported a net loss of $(2.1) million this year compared to net income of approximately $1 million the prior year. This worked out to a net loss of $(.17) per share for the quarter compared with a profit of $.08/share the prior year.
According to analysts polled by Thomson Financial, the company actually beat expectations on earnings by no losing as much as was expected (!). Analysts were looking for a loss of $(.21)/share during the quarter. However, the company disappointed on revenue, as analysts were expecting revenue of $11.2 million during the period.
Reviewing the Morningstar.com '5-Yr Restated' financials on NURO, we can see that after growing their revenue from $9 million in 2003 to $55 million in 2006, the company dipped to $45 million in 2007. Earnings likewise improved from a loss of $(5.66) in 2003 to a profit of $.33/share in 2006 then turned negative at $.66 in 2007. Outstanding shares increased from 1 million in 2003 to 13 million in 2005 but have stayed stable since.
Free cash flow increased from $1 million in 2005 to $7 million in 2006 then turned negative at $(8) million in 2007. The balance sheet is solid with $7 million in cash and $35 million in other current assets easily covering the $8.7 million in current liabilities and the $.9 million in long-term liabilities reported on Morningstar.
Finally, looking at the 'point & figure' chart on NeuroMetrix (NURO) from StockCharts.com, we can see the dismal price performance of this pick. The stock declined gradually from $41 in April, 2006, to a level of $11.00 in January, 2008, only to plunge recently to the $1.92 level in March, 2008.
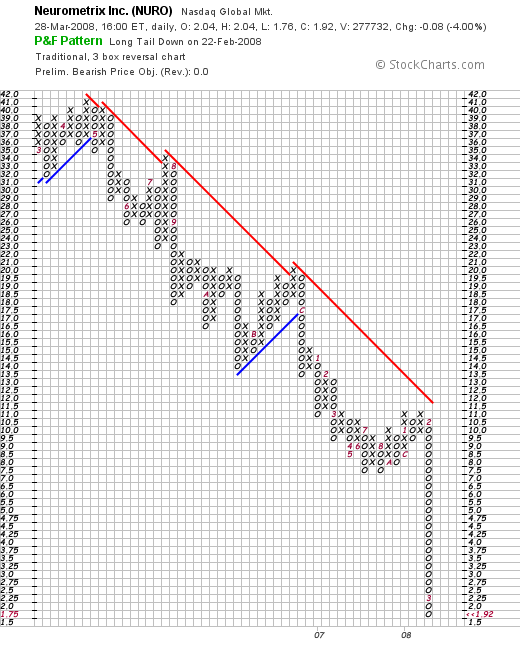
Even though it appears rather late with this assessment, with the poor earnings report, the poor Morningstar.com page, and the terribly weak price chart,
NEUROMETRIX (NURO) IS RATED A SELL
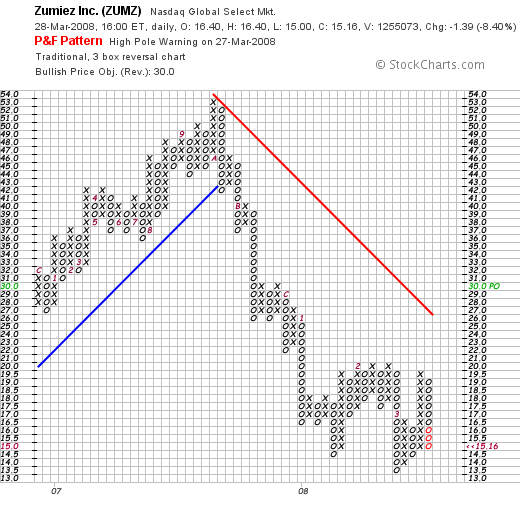
 Finally, on September 16, 2006, I posted Zumiez (ZUMZ) on Stock Picks Bob's Advice when the stock was trading at $26.24 per share. I do not own any shares or options on this company.
Zumiez closed at $15.16 on March 28, 2008, for a loss of $(11.08) or (42.2)% since posting.
On March 14, 2008, Zumiez (ZUMZ) reported 4th quarter 2007 results. For the quarter ended February 2, 2008, total net sales increased 12.7% to $126.6 million from $112.4 million in the same quarter last year. Net income for the quarter came in at $12.4 million or $.42/diluted share up from $11.3 million or $.39/share last year.
However, while positive, the torrid rate of growth at this retailer slowed considerably. For the quarter, same-store sales increased 4.0% compared with last year's same-store sales growth of 12.0%.
The company beat expectations during the quarter both on earnings and revenue. Sales, according to analysts polled by Thomson Financial, had been expected to come in at $126.1 million (they camne in at $126 million) and earnings were expected at $.38/share (they came in at $.42/share).
The company predicted low single digit same store sales growth in 2008 and profit of about $.90 to $.93/share. This was essentially in line with analysts' expectations for $.92/share in 2008.
With the recent recession fears and reports of weak retail sales, it is not surprising that Oppenheimer analyst Roxanne Meyer recently cut the ratings of Zumiez to "perform". However, with the relatively strong quarterly report,
ZUMIEZ (ZUMZ) IS RATED A HOLD
Reviewing the Morningstar.com '5-Yr Restated' financials, we can see that the record of steady revenue growth, earnings growth, stable shares, and positive free cash flow is intact. The balance sheet is solid with $136 million in total current assets, compared to $43.4 million in current liabilities and the $18.1 million in long-term liabilities.
Finally, looking at the 'point & figure' chart on Zumiez from StockCharts.com, we can see the terrible weakness in the price chart that developed in October, 2007, when the price declined from a peak of $53 to a low of $13.50 in March, 2008. Currently at $15.16, the stock is struggling to find support at this lower level. I do not like the technicals on this chart, but from the earnings news and the Morningstar.com report, I have to feel that the reaction of the street must be overdone on this chart and a reversal in price sentiment must soon be overdue.
So how did I do during that week in September, 2006? In a word, mediocre! The four stocks 'picked' during the week experienced an average loss of (35)% since posting. This certainly shows the risk of an kind of buy and hold strategy in a dynamic environment where prospects for companies do change.
In any case, thank you again for visiting! If you have any commnents or questions, please feel free to leave them on the blog or email me at bobsadviceforstocks@lycos.com.
If you get a chance, be sure and visit my Covestor Page where my actual trading account is tracked and analyzed, my SocialPicks Page where my stock picks from the last year or so have been monitored, and my Podcast Page where you can listen to me discuss some of the same stocks I write about here on this website.
Have a great Sunday and a solid week ahead.
Yours in investing,
Bob
Posted by bobsadviceforstocks at 6:35 PM CDT
|
Post Comment |
Permalink
Updated: Tuesday, 8 April 2008 11:13 AM CDT
Newer | Latest | Older


