Stock Picks Bob's Advice
Thursday, 26 January 2006
"Revisiting a Stock Pick" National Instruments (NATI)
Hello Friends! Thanks so much for stopping by and visiting my blog,
Stock Picks Bob's Advice. As always, please remember that I am an amateur investor, so please remember to consult with your professional investment advisors prior to making any investment decisions based on information on this website.

As I like to do when looking for a stock to discuss on this blog, I reviewed the
list of top % gainers on the NASDAQ and came across National Instruments Corp. (NATI) which shortly before the close of trading today, is trading at $36.81, up $4.05 or 12.36% on the day. I do not own any shares of NATI, nor do I have any options.
National Instruments is an old favorite of mine on this blog. I first
posted NATI on Stock Picks Bob's Advice on July 28, 2004, when it was trading at $27.89. Thus, the stock is currently trading $8.92 higher than the "pick price" or ahead by 32.0%.
And what does NATI do? According to the
Yahoo "Profile" on National Instruments, the company
"...engages in the design, development, manufacture, and marketing of measurement and automation products. The company offers instrumentation software and computer plug-in cards, and accessories that users combine with computers, networks and the Internet to create measurement and automation systems."
And how about the latest quarter? As is the case with so many stocks that are discussed on this blog, the driving force behind the big stock gain today was a great earnings report. Yesterday, after the close of trading, National Instruments
announced 4th quarter 2005 results. Revenue for the quarter came in at $160 million, up 175 from the $137 million reported in the same quarter last year. Net income worked out to $21 million, up 27% from the $16.5 million in the same quarter last year. Diluted earnings per share climbed 30% to $.26/share up from $.20/share the prior year. The company also increased the quarterly dividend 20% this quarter to $.06/share.

How about longer-term? Taking a look at the
Morningstar.com "5-Yr Restated" financials, we can see the steady revenue growth (except for a dip from $410.1 million in 2000 to $385.3 million in 2001) to $514.1 million in 2004 and $549.2 million in the trailing twelve months (TTM).
Earnings, which also dipped from $.69/share in 2000 to $.39/share in 2002, have increased steadily since then to $.59/share in 2004 and $.70/share in the TTM.
According to Morningstar, the company paid its first dividends in 2003 with $.07 paid. This has increased to $.18 in 2004 and $.20/share in the TTM.
Free cash flow has been growing very nicely with $18 million in 2002, $45 million in 2003, $53 million in 2004 and $83 million in the trailing twelve months.
The balance sheet is very nice per Morningstar, with $180.7 million in cash, more than enough to pay off both the $84.7 million in current liabilities and the $13.3 million in long-term liabilities combined almost two times over. In addition, Morningstar reports the company with $166.7 million in other current assets.
And how about valuation? Looking at
Yahoo "Key Statistics" on National Instruments, we find that the stock is a mid cap company with a market capitalization of $2.90 billion. The trailing p/e is a bit rich at 52.21, the forward p/e (fye 31-Dec-06) is just a bit better at 39.89. The PEG ratio (5 yr expected) is also a bit steep at 1.83.
According to the
Fidelity.com eResearch website, NATI is moderately priced in terms of the Price/Sales ratio in the "System Software" industrial group.
Topping this group is Infosys (INFY) with a Price/Sales ratio of 11.0. This is followed by Autodesk (ADSK) at 7.1, National Instruments (NATI) at 4.8, Mercury Interactive (MERQ.PK) at 3.8, Manhattan Associates (MANH) at 2.6, and Take-Two Interactive (TTWO) at 0.9.
Looking back at Yahoo for some additional numbers on this stock, we can find that there are 79.14 million shares outstanding. Of these, 1.74 million shares were out short as of 12/12/05. This represents 3.10% of the float or 6.2 trading days of volume. Since I use a 3 day short ratio as a cut-off for my own evaluation, I consider 6.2 days of short-interest to be significant and may be fueling the current price appreciation on the good news in the earnings report.
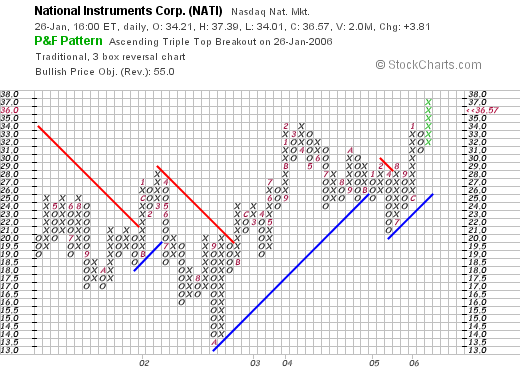
And what about a chart? Taking a look at the
"Point & Figure" chart on National Instruments (NATI), we can see that the stock was trading lower between April, 2001, and October, 2002, when it bottomed at around $13.50. The stock since then, in line with the earnings improvement, has fairly steadily appreciated to the current $36.57 level.
So what do I think about this stock? Well, first of all, the company had a nice move today with a large supply of short-sellers that are probably scrambling to cover their sales. The latest quarterly result was strong with both strong revenue and earnings results. Since 2002, the earnings and revenue have been growing steadily. The company even has a growing cash dividend! In addition, NATI is 'throwing off' a growing amount of free cash, and the balance sheet is quite nice as is the graph of the stock price.
On the downside valuation is rich, with both a P/E and PEG higher than I like to see them. The Price/Sales is moderate within its group of stocks.
However, the stock still fits into my own criteria and it is always nice to see a company that was doing well enough to be posted here on the blog, to show up again two years later once again moving higher in a strong fashion.
Thanks again for stopping by. If you have any comments or questions, please feel free to leave them on the blog or email me at bobsadviceforstocks@lycos.com.
Bob
Wednesday, 25 January 2006
"Revisiting a Stock Pick" Trimble Navigation (TRMB)
Hello Friends! Thanks so much for stopping by and visiting my blog,
Stock Picks Bob's Advice. As always, please remember that I am an amateur investor, so please remember to consult with your professional investment advisors prior to making any investment decisions based on information on this website.

Please excuse me for not posting for a few days. I can assure you that it was harder on me than for you :). Went down to New Orleans for a few days to help with my in-laws as they were struggling to deal with their flood-damaged home. The scope of the devastation must be seen to be believed. All of my prayers are still with those who have suffered so much in that wonderful City!
I was looking through the
list of top % gainers on the NASDAQ today, and saw that an old favorite of mine, Trimble Navigation (TRMB) had made the list. TRMB closed at $41.76, up $6.74 or 19.25% on the day. I do not own any shares of this stock nor do I own any options.
I first
posted Trimble Navigation (TRMB) on Stock Picks Bob's Advice on April 28, 2004, when it was trading at $25.98. With today's close at $41.76, that gives me a gain of $15.78 on the stock pick or 60.7% since posting. It is interesting that the factor that led to its price rise two years ago was the same as the factor that caused the stock to climb today: excellent earnings reported.
Let's take a look at this stock that continues to do well in the market.
First of all, what does the company
do? Looking at the
Yahoo "Profile" on Trimble, we find that the company
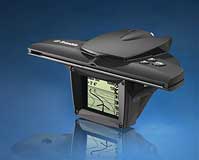
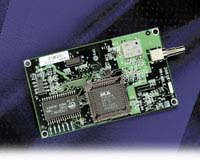
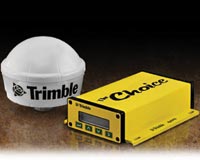
"...provides advanced positioning products, services, and solutions to commercial and government users in various markets, including surveying, construction, agriculture, urban and resource management, military, transportation, and telecommunications. The company’s positioning portfolio includes global positioning system (GPS), laser, optical, and inertial technologies. Its products include earthmoving equipment guidance systems, surveying instruments, fleet management systems, components for in vehicle navigation and telematics systems, farm equipment guidance systems, field data collection handhelds, and timing modules used in the synchronization of wireless networks."
What drove the stock higher, as I discussed above, was the release of
4th quarter and fiscal 2005 earnings results yesterday after the close of trading. For the quarter ended December 30, 2005, revenue came in at $186.8 million up 15% from revenue of $162.7 million in the same quarter last year. Net income worked out to $23.4 million, or $.41/share, up 43% compared with net income of $16.4 million or $.29/share last year.
How about longer-term? Taking a look at the
Morningstar.com "5-Yr Restated" financials, we can see the beautiful progression of earnings from $369.8 million in 2000 to $668.8 million in 2004 and $750.8 million in the trailing twelve months (TTM).
Earnings, as is often the case, have not been quite as steady with a dip from $.37/share in 2000 to a loss of $(.62)/share in 2001. However, since that time earnings have steadily increased to $1.23 in 2004 and $1.37 in the TTM.
Free cash flow the past few years has been strongly positive and growing. $25 million was reported in 2002, increasing to $60 million in 2004 and $72 million in the TTM.
The balance sheet looks solid with $87.3 million in cash and $273.7 million in other current assets. This is plenty to cover both the $128 million in current liabilities and the $27.8 million in long-term liabilities combined more than two times over.
And valuation? Looking at
Yahoo "Key Statistics" on TRMB, we find that the company is a mid cap stock with a market capitalization of $2.25 Billion. The trailing p/e isn't too bad at 30.42 and the forward (fye 31-Dec-06) p/e is even better at 25.31. With the steady growth predicted, the PEG comes in at a reasonable 1.35.
Using the
Fidelity.com eResearch website, we find that TRMB is also reasonably priced in terms of the Price/Sales ratio relative to other stocks in the "Scientific/Technical Instruments" Industrial Group. Leading this group for the Price/Sales ratio is Garmin (GRMN) with a Price/Sales ratio of 7.5. This is followed by Flir (FLIR) at 3.8, Agilent (A) at 3.3, Trimble (TRMB) at 2.7, Fisher Scientific (FSH) at 1.6, and Beckman Coulter (BEC) at 1.5.
Returning to Yahoo for some more numbers, we find that there are 53.79 million shares outstanding with 1.39 million of them out short as of 12/12/05, representing 2.60% of the float or 4.6 trading days of volume. Personally, I have chosen to use 3 days of volume out short as significant, and today's sharp rise might just represent a bit of a panic or squeeze among those betting the stock should be declining.
No cash dividends are paid, and the last stock split was a 3:2 split on 3/5/04, just a few weeks before I posted this particular stock on Stock Picks Bob's Advice.
And how does the chart look? Taking a look at the
"Point & Figure" chart on Trimble from Stockcharts.com:
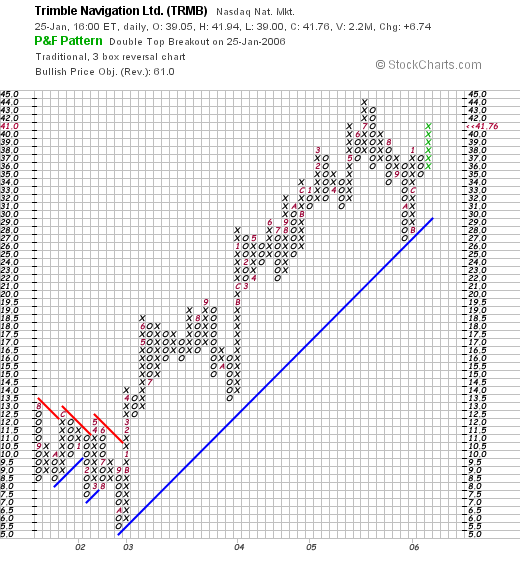
We can see that the stock was trading a little weakly between August, 2001, and October, 2002, when the stock bottomed at $5.00/share. Since then, the company has had a beautiful chart with a steady climb to the current $41.79 level, without looking "over-extended" in stock price to my amateur eyes.
So what do I think? First of all, it is nice to be back blogging after a hiatus of a few days. Now, insofar as this stock is concerned, the stock meets my criteria with a nice price rise today, a great quarterly report just released with growth in both revenue and earnings, and a very nice Morningstar.com financial statement with steady revenue growth the past five years, steady earnings growth the last several years, positive and growing free cash flow, and a gorgeous chart. Valuation is a little rich, but in light of the stock's performance, buying this stock at a discount now is just out of the question!
If you have any comments or questions, please feel free to email me at bobsadviceforstocks@lycos.com or leave them right here on the blog!
Bob
Thursday, 19 January 2006
January 19, 2006 Bolt Technology (BTJ)
Hello Friends! Thanks so much for stopping by and visiting my blog,
Stock Picks Bob's Advice. As always, please remember that I am an amateur investor, so please remember to consult with your professional investment advisors prior to making any investment decisions based on information on this website.
Click
HERE for my ***PODCAST*** on BOLT TECHNOLOGY and a READER ON SELLING RESISTANCE
The market rebounded nicely today. It is so hard to determine what the market will do in the short run.
Looking through the
list of top % gainers on the AMEX, I came across Bolt Technology Corporation (BTJ), that had a nice day today, closing at $17.86, up $1.26 or 7.06% on the day. I do not own any shares nor do I have any options on this stock.
According to the
Yahoo "Profile" on BTJ, the company
"...and its subsidiaries engage in the development, manufacture, and sale of seismic energy sources used in the offshore seismic exploration for oil and gas worldwide. It operates in two segments, Geophysical Equipment and Industrial Products. Geophysical Equipment segment develops, manufactures, and sells marine seismic energy sources and underwater electrical connectors and cables, air gun signature hydrophones, and pressure transducers used by the marine seismic industry."
With the oil price soaring, oil service companies like Bolt are doing well in the market.
On October 25, 2005, Bolt
reported 1st quarter 2006 results. Revenue for the quarter ended September 30, 2005, increased 108% to $7.99 million, compared with $3.8 million in the same quarter the prior year. Net income increased 383% to $1.02 million or $.18/share, up from $211,000 or $.04/share the prior year same period. This was a very strong report for this small company.
And what about longer-term? Taking a look at the
Morningstar.com "5-Yr Restated" financials, we can see that revenue has been erratic up to the last few years, increasing from $15 million in 2001 to $18 million in 2002, only to drop to $11 million in 2003. However, since 2003, revenue has steadily grown to $18.8 million in 2005 and $23 million in the trailing twelve months (TTM).
Earnings have also been a bit erratic, climbing from $.07/share in 2001 to $.35/share in 2002, only to drop to a loss of $(.03) in 2003. However, since 2003, earnings have grown steadily to $.30/share in 2005 and $.44/share in the TTM.
Free cash flow has stayed positive increasing from $0 in 2003 to $1 million in 2005 and the TTM.
The balance sheet, even with the relatively small numbers, looks fine with $4.0 million in cash balanced against $3.6 million in current liabilities and $.4 million in long-term liabilities. In addition, the company has another $11.1 million of other current assets on the books per Morningstar.
How about valuation? Looking at
Yahoo "Key Statistics" on Bolt, we can see that this is really a MICRO cap stock, with a market capitalization of only $97.0 million. I consider anything under $100 million to be in the micro cap size!

According to Yahoo, the trailing p/e is 40.23. No forward p/e is reported and no PEG is noted on Yahoo either. This is a very small company with apparently few analysts watching.
According to the
Fidelity.com eResearch website, Bolt is in the "Oil & Gas Equipment/Services" Industrial Group. Within this group, Bolt has a Price/Sales ratio of 4.4, only Schlumberger (SLB) is higher at 5. BTJ is followed by BJ Services (BJS) at 4.0, Baker Hughes (BHI) at 3.4, Cooper Cameron (CAM) at 2.3 and Halliburton (HAL) at 1.8.
Other numbers from Yahoo show that there are only 5.44 million shares outstanding with 17,930 shares out short, representing 0.40% of the float. The company is not reported to pay a dividend on Yahoo, and no stock splits are reported as well.
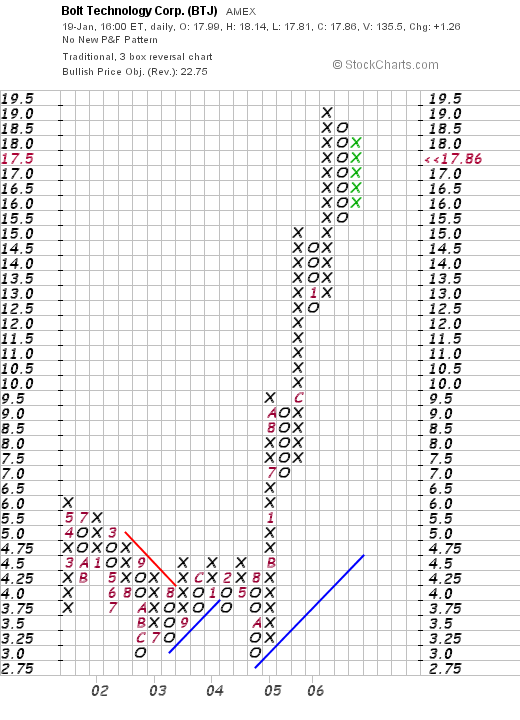
What about a chart? Looking at a
"Point & Figure" chart on BTJ from Stockcharts.com, we can see that the stock was slowly declining between May, 2001, when it was trading at $6.00, until July, 2003, when it hit $3.00. During 2003 the stock tried to move higher, breaking down once again in October, 2004, back to the $3.00 level. Since that time in 2004, the stock has been climbing strongly to its current level of $17.86.
And what do I think about this company. First of all, it is a TINY company with a market capitalization under $100 million. I am afraid about the potential volatility of these shares if anyone tries to "get in" or "get out". But except for that, the latest quarter was extremely strong, the last few years look promising, with positive free cash flow and a nice balance sheet.
On the downside, the stock is subject to price fluctuation based on the commodity price of oil. Other than that, thinks look quite good and the stock is attractive. Just highly risky.
Thanks so much for stopping by! If you have any comments or questions, please feel free to email me at bobsadviceforstocks@lycos.com.
Bob
Posted by bobsadviceforstocks at 9:03 PM CST
|
Post Comment |
Permalink
Updated: Thursday, 19 January 2006 10:19 PM CST
Wednesday, 18 January 2006
A New PODCAST on dealing with a bear market!
Please click
HERE for my PODCAST ON DEALING WITH A BEAR MARKET. Thanks for visiting. Drop me a line at bobsadviceforstocks@lycos.com if you have any questions.
Bob
Sunday, 15 January 2006
"Weekend Trading Portfolio Analysis" Meridian Biosciences (VIVO)

Click
HERE for my ***PODCAST ON MERIDIAN***Hello Friends! Thanks so much for stopping by and visiting my blog,
Stock Picks Bob's Advice. As always, please remember that I am an amateur investor, so please remember to consult with your professional investment advisors prior to making any investment decisions based on information on this website.
I try to do several things at the same time on this website. I like to discuss philosophy of investing, review stock "picks" that I have identified, and also share with you my actual trading portfolio so that you can, in a virtual reality kind of way, share with me my experience in investing, making investment decisions, and deciding whether my strategy is successful. Some of my stock selections are successful, some do poorly; just like any investor, I experience my share of successes and failures. This past year I have been trying to review a stock in my actual trading portfolio each weekend. Going alphabetically through the symbols, I am up to Meridian Biosciences (VIVO). I actually first
discussed Meridian Bioscience (VIVO) on Stock Picks Bob's Advice on 4/22/04 when it was trading at $11.22. I then
"revisited" VIVO on Stock Picks Bob's Advice when it was traded at $16.26 on 4/21/05.

I currently own 210 shares of Meridian Biosciences (VIVO) that were acquired on 4/21/05, a bit under a year ago, at a cost basis of $11.13. VIVO closed on 1/13/06 at $24.40, giving me a gain of $13.27 or 119.2%. I have sold portions of VIVO four times (as is my strategy) on 7/25/04, 9/1/05, 10/3/05, and 1/6/06. These sales were approximately at the 30%, 60%, 90%, and 120% gain points. Initially, I have been selling 1/4 positions, but lately, I have reduced these portions of remaining shares down to 1/6 of my positions to allow my positions to grow.
By my strategy, my next planned sale will be 1/6 of my remaining shares at a gain of 180% or to calculate, that will work out to 2.8 x $11.13 = $31.16. On the downside, if the stock retraces to 50% of the highest gain sale point, which would be 50% of 120% or 60%, my sale target would be 1.6 x $11.13 = $17.81.
Let's take a closer look at this company!
Let's first take a look at what this company does. According to the
Yahoo "Profile" on VIVO, the company
"...operates as an integrated research, development, manufacturing, marketing, and sales organization in the field of life science. It develops, manufactures, and distributes diagnostic test kits primarily for respiratory, gastrointestinal, viral, and parasitic infectious diseases; and bulk antigens, antibodies, and reagents used by researchers and other diagnostic manufacturers, as well as provides contract manufacturing service of proteins and other biologicals for use by biopharmaceutical and biotechnology companies that are engaged in research for new drugs and vaccines."
And how was the latest quarterly result? On November 10, 2005, Meridian
reported 4th quarter 2005 results. Net sales came in at $25.0 million up 12% from $22.2 million in the same quarter last year. Net earnings came in at $3.8 million, up 28% from the $2.9 million in the prior year. Diluted earnings per share rose 15% to $.15/share, up from $.13/share last year. In addition, the company actually
raised its dividend for 2006 by 44% to estimated $.46/share. Overall, a nice report.
And how about longer-term results? Does Meridian still show consistency in the Morningstar report? Reviewing the
Morningstar.com "5-Yr Restated" financials, we can see the steady growth in revenue from $56.1 million in 2001 to $93 million in 2005. Earnings have also steadily improved from a loss of $(.47) in 2001 to $.52/share in 2005. Dividends have also been consistently increased from $.17/share in 2001 to $.31/share in 2005. Dividends by themselves are a bit unusual in as small a company as this!
Free cash flow looks good with $11 million in 2003 improving to $16 million in 2005.
The balance sheet is solid with $33.1 million in cash and $37.1 million in other current assets. The cash alone is adequate to cover both the $19.8 million in current liabilities and the $7.0 million in long-term liabilities.

And what about "valuation"? Reviewing the
Yahoo "Key Statistics" on Meridian, we can see that this is a mid-cap stock with a market capitalization of $635.86 million. For those that are new to all of this, recall that market capitalization is calculated by multiplying the total number of shares outstanding by the market price of each share.
VIVO has a p/e of 46.83 which is certainly a bit rich. The forward p/e is 31.28 (fye 30-Sep-07), which is still a bit pricey. The PEG is calculated (5 yr estimated) at 2.12.
Looking at the
Fidelity.com eResearch website, we can see that VIVO has a rich price/sales ratio of 6.3, but this isn't that high compared to the other stocks in the "Diagnostic Substances" group. Leading this group is Nuvelo (NUVO) with a Price/Sales ratio of 1605.3, then Human Genome Sciences (HGSI) at 126.4, Oscient (OSCI) at 11.6, the Meridian (VIVO) at 6.3, QLT (QLTI) at 2.6 and Dade Behring (DADE) at 2.2.
Finishing up with Yahoo, we can see that there are 26.06 million shares outstanding. Currently (12/12/05) there are 892,350 shares out short, representing 4.20% of the float or 3.1 trading days of volume (short ratio). Using my 3 day rule of significance, this doesn't look like much of a short interest to pressure this stock higher.
As noted, the company is anticipated to pay $.46/share in dividends in the next year, yielding 1.90%. The stock last split 3:2 on 9/6/05.
And what about a chart? If we review the
"Point & Figure" chart on VIVO from Stockcharts.com:
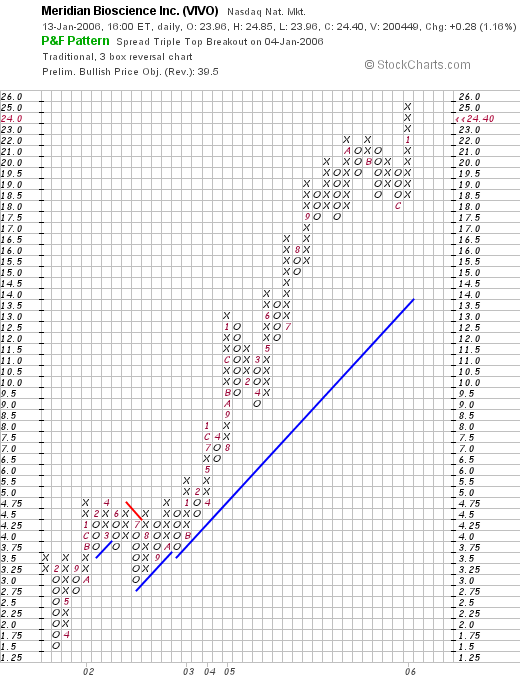
, this is simply a gorgeous graph with the stock climbing sharply from $1.50 in February, 2001, to the current $26 level. If anything the stock looks a bit over-extended. And what I mean by that is that the stock appears to be moving higher faster than the 45 degree blue support line. Is that significant? Not necessarily. I don't know why a stock has to follow any particular line :).
So what do I think? I think I have been lucky to own shares of this company and I don't think its growth is over. This is a small company with lots of room to grow!
Reviewing some of the criteria I discussed, the last quarter results look great, the Morningstar.com report is solid, valuation-wise, the p/e is a bit high as is the price/sales ratio suggesting this is an expensive stock, no bargain here. Finally the chart looks great! Anyhow, that's the review.
Thanks for stopping by. If you have any comments or questions, please feel free to leave them on the blog or email me at bobsadviceforstocks@lycos.com.
Bob
Posted by bobsadviceforstocks at 11:09 AM CST
|
Post Comment |
Permalink
Updated: Sunday, 15 January 2006 1:34 PM CST
Saturday, 14 January 2006
"Looking Back One Year" A review of stock picks from the week of November 1, 2004

Hello Friends! Thanks so much for stopping by and visiting my blog,
Stock Picks Bob's Advice. As always, please remember that I am an amateur investor, so please remember to consult with your professional investment advisors prior to making any investment decisions based on information on this website.
Each weekend, unless I just plain fail to get around to it, I like to review stock picks from about a trailing one year period. This week I am up to the week of November 1, 2004. This review assumes a "buy and hold" strategy which is not thae actual strategy that I employ in my own portfolio. I like to sell my losing stocks quickly and completely, and my gaining stocks slowly and partially. But for the sake of this analysis, I believe a buy and hold review gives you a good feeling for the performance of stocks selected on this blog.

CalDive (CDIS) is a stock that besides writing it up as a 'pick', I also do own in my trading portfolio. I
picked CalDive (CDIS) on Stock Picks Bob's Advice on November 3, 2004, when it was trading at $38.25. CDIS had a 2:1 stock split, giving me an effective 'pick price' of $19.13. CDIS closed at $42.10 on 1/13/06, for a gain of $22.97 or 120%.

On November 1, 2005, CalDive
reported 3rd quarter 2005 results. For the quarter ended September 30, 2005, revenue climbed 58.6% to $209.3 million from $132.0 million the prior year. Net income grew 87% to $42.7 million from $22.8 million the prior year. Diluted earnings per share rose 78% to $1.05/share from $.59/share last year in the same period. This was a very strong report!

On November 5, 2004, I
posted ValueClick (CCLK) on Stock Picks Bob's Advice when it was trading at $10.91. VCLK closed at $20.64 on 1/13/06 for a gain of $9.73 or 89.2% since picking this stock for the blog!
On November 1, 2005, ValueClick
reported 3rd quarter 2005 results. For the quarter ended September 30, 2005, revenue grew 87% to $81.4 million from $37.9 million in the prior year same quarter. Net income for the quarter came in at $11.0 million or $.13/diluted share, compared with $7.6 million or $.09/diluted share in the prior year same quarter. In addition, the company raised fiscal 2005 guidance; all-in-all this was a very nice earnings report!
So how did we do on these two stocks? Well quite well actually. CDIS had a gain of 120% and VCLK had a gain of 89.2% during this same period. this works out to an average gain of 104.6%. Not too shabby at all :).
Anyhow, thanks again for stopping by! I shall try to get to my trading portfolio review tomorrow if I get a chance. You know how that is. If you have any comments or questions, please feel free to leave them on the blog or email me at bobsadviceforstocks@lycos.com.
Regards!
Bob
Nike (NKE) A Reader Writes "The Nike buy was on the advice of my broker. And it made me vera vera nervous."
Hello Friends! Thanks so much for stopping by and visiting my blog,
Stock Picks Bob's Advice. As always, please remember that I am an amateur investor, so please consult with your professional investment advisors prior to making any investment decisions based on information on this website.

I had a nice letter from a Xanga reader "Y" who writes:
I am sitting here, waiting for the chair-thrower to come on, eating spaghetti out of the pan. At least it's homemade. Bob, I was thrilled to read this: "Don't stick to any specific strategy. Use all strategies." Because I've begun to trade faster. And lose faster :) Today I bought Nike, after selling off my mutual funds that hadn't done much for me lately. The Nike buy was on the advice of my broker. And it made me vera vera nervous. Because I didn't take the time to research it. I just trusted his advice. He said get in at 85 something and get out at 88 or 90. He read me the chart for the last few months and by the time I said okay it had gone up to 86 something. I had to meet a friend for lunch and prayed the whole time I was gone it wouldn't go up. Or down. How do you leave the house? Do you trade over the phone?
I took some off the top yesterday AND today. I took 1/6th off Starbucks and Vertex. The other theory of yours I am using is this idea that you buy a stock when it is soaring. I didn't like that idea because it seemed so after-the-fact but for the short term it makes sense to me.
So I watched the chairs fly. And, as I checked back to see what his yesterday's picks had done, I saw a uniform rise of two points. No matter what the percentage, if it was 60 last night, by closing today it was 62. How do you say that? Is that points or something else? Anyway, the only way to win at that game is to go online and place your buy after the show. But don't the -- And I can never keep these straight -- I think the bid is the buy, doesn't that get jacked up because of his show? So by morning you're probably getting it at 61 and selling it at 62 because it probably drops the next day. Maybe not. Have you tracked his picks?

Wow! That was a whole lot of a comment. Let me try to address what you have written and then take a short look at Nike (NKE).
I believe that Jim Cramer, the "chair-thrower" is a bright guy. He does his homework. He has some interesting ideas. But it isn't my style.
You write that you have begun to trade "faster", "And lose faster :)". That isn't what I would call a good idea! One of the things I strongly believe is that if you have made a sale at a loss, sit on your hands and don't reinvest that money until you have sold a portion of a stock at a gain.
And do not arbitrarily sell this and buy that. Have a plan, an approach to your portfolio, even if you have a broker assisting you with all of this, which I fully support.
I don't believe in getting into a stock at say 85 and get out at 90. That isn't my approach at all. I don't get out of a stock completely unless something goes
wrong not if something goes
right. I believe in bailing out of a stock on "bad news". That may be something fundamentally wrong that is announced by the company, or it may be just that price performance lags and the stock hits one of my sale points on the downside. You know about those. If you don't I can explain again another time.
So I would hope that you would build a portfolio of the finest companies on Wall Street. And that you hold those stocks until your ripe old age. That at least is my goal. I am always prepared to unload a company that fails to perform properly, but I don't want to punish a strong stock by selling all of it just because it went up a few points.
By the way, I do leave the house. I generally trade online. When I am on vacation, I do tend to be a pain to the rest of my family and look for a laptop or a quick WiFi connection in my hotel room. I don't own a laptop now, but two of my kids do!
I think it is a good idea to peel off some of your gains like you have done. Don't just do it arbitrarily as you go forward in the future, but use these sales as signals to add positions. And I don't just buy stocks when they are "soaring". They may be pretty high, that is a CANSLIM attitude about buying stocks at new highs, but what I am looking for is stocks that are
gaining not soaring. Those stocks that are moving higher out of proportion to the rest of the stock market. That is where I start my search for new stock picks.
So what to do about Kramer? Watch and enjoy. But don't try to get into that pack. Think about the three hundred or so "pilgrims" who got trampled in the latest Saudi Arabian disaster in Mecca. You don't want to go into a mob and try to buy a stock fighting other investors who don't necessarily have any individual understanding of stocks but who are tuned into the latest chair-throwing episode.
You will have a better chance at making a profitable trade buy examining stocks in a quiet environment, thinking on your own, consulting with your professional advisor, and developing your own strategy for investing. You are welcome to adopt any part of mine, or use Cramer's ideas, or anyone else's. And finally, I don't have the time to track his picks. And he probably doesn't track mine either :).

But let's take a look at Nike and see what I think about how it fits into my particular perspective on stocks. Always remember, I am completely unable to say whether Nike is going to go up or down in price. But maybe I can tell you whether this stock fits into my perspective of investing decisions. I do not own any shares of Nike nor do I have any options on this stock.
O.K. Nike. Nike (NKE) closed at $86.20, down $.11 or 0.13% yesterday (January 13, 2006).
What do they do? Looking at the
Yahoo "Profile" on Nike, we see that the company
"...and its subsidiaries engage in the design, development, and marketing of footwear, apparel, equipment, and accessory products worldwide. It designs athletic footwear for running, cross training, basketball, soccer, sport inspired urban shoes, and children’s shoes. The company also offers shoes and sports apparel for tennis, golf, baseball, football, bicycling, volleyball, wrestling, cheerleading, aquatic activities, hiking, outdoor activities, and other athletic and recreational uses primarily under the ‘NIKE’ brand name. In addition, it sells sports inspired lifestyle apparel, as well as athletic bags and accessory items. Further, NIKE sells a line of performance equipment, including golf clubs, sport balls, eyewear, timepieces, electronic media devices, skates, bats, gloves, swimwear, cycling apparel, children’s clothing, school supplies, and eyewear. Additionally, the company sells a line of dress and casual footwear, apparel and accessories for men and women."
Latest quarter? On December 20, 2005, Nike
reported 2nd quarter 2006 results. Sales grew 10% to $3.5 billion, from $3.1 billion. Profits climbed 15% to $301 million, and they earned $1.14/share up from $.97/share the prior year. This was $.11 ahead of analysts expectations. It is always better to surprise on the upside than to disappoint on the downside!
However, the company
did signal a cautionary note:
"But Nike said currency exchange rates "significantly reduced growth" in future orders, which increased 2.5 percent to $5.2 billion compared to the same period last year."
So while it was a nice report with growing revenue and earnings and the company did exceed expectations, the cautionary note is enough to give an investor at least a little bit of a pause. I am sure the market has absorbed that news and is already looking beyond that issue.
How about longer-term? Taking a look at the
Morningstar.com "5-Yr Restated" financials, we can see that revenue has grown steadily from $9.5 billion in 2001 to $13.7 billion in 2005 and $14.0 billion in the trailing twelve months (TTM).
Earnings have been a bit erratic, dropping from $2.44 in 2002 to $1.77 in 2003. However, since that time they have grown strongly to 44.48 in 2005 and $4.88 in the TTM.
Free cash flow also looks nice with $736 million in 2003 increasing to $1.2 billion in the TTM.
The balance sheet is also solid with $1.9 billion in cash and $4.8 billion in other current assets. This easily covers both the $2.2 billion in current liabilities and the $.9 billion in long-term liabilities combined with over $3.5 billion left over!
Let's take a look at some valuation numbers.

Looking at
Yahoo "Key Statistics" on NKE, we find that this is a large cap stock with a market capitalization of $22.35 billion. The trailing p/e doesn't look bad at 17.01, and the forward p/e (fye 31-May-07) is even nicer at 14.91. The PEG which considers the future growth rate compared to the p/e is nice at 1.14, with 1.0 being ideal.
According to the
Fidelity.com eResearch website, Nike is in the "Textile-Apparel Footwear/Accessories" industrial group. Topping out this group in terms of Price/Sales is Coach (COH) with a ratio of 7.1. This is followed by a bunch of companies grouped closely, starting with Nike at 1.6, Timberland at 1.5, Wolverine World Wide at 1.3 and Reebok at 1.0. Thus by this parameter as well, Nike doesn't look too over-valued.
Some other numbers: Nike has 259.3 million shares outstanding. Currently there are 3.45 million shares out short (12/12/05), representing 1.80% of the float. This doesn't look to be much of a factor.
The stock does pay a small dividend of $1.24/share yielding 1.40%. The last time the stock split, per Yahoo, is 10/24/96, when Nike distributed shares for a 2:1 stock split.
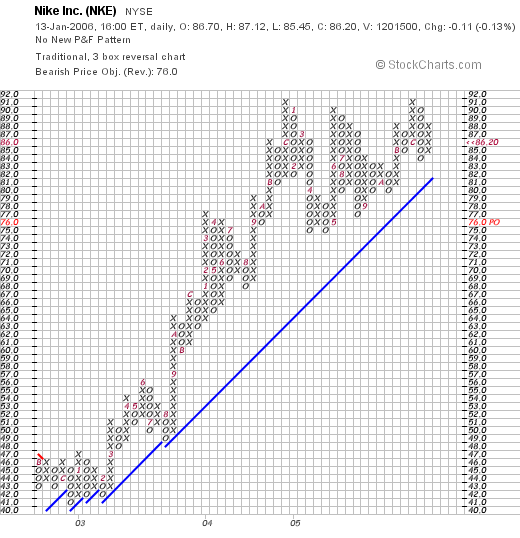
What about the chart? Looking at the
"Point & Figure" chart on Nikewe can see that the stock has been trading strongly higher since February, 2003, when it broke out of a "triangle formation" at around $43 and traded sharply higher since that time to its current levels around $86. This is a very strong graph imho.
So what do I think? Well, first of all I hope I answered your questions on Cramer. I am actually a fan of his and I like to watch his show. If nothing else to see what he is thinking about things. Sometimes his ideas and mine coincide and that is a plus imho, like when he also like Palomar (PMTI). But I don't trade based on his recommendations. I have my own system.
As far as Nike is concerned. It looks to be a great stock. I just wouldn't be in it "for a trade" as they say in the business. This is investable material and you might just want to do what I do (?) and sell your gainers slowly and partially and sell your losers completely and quickly!
Thanks again for writing. Keep me posted on how things work out and if you or anyone else have questions or comments, please feel free to leave them on the blog or email me at bobsadviceforstocks@lycos.com.
Bob
Friday, 13 January 2006
New ***PODCAST*** on JLG and Investment Philosophy
Hello Friends! Thanks so much for stopping by and visiting my blog,
Stock Picks Bob's Advice. As always, please remember that I am an amateur investor, so please consult with your professional investment advisors prior to making any investment decisions based on information on this website!
Here is the
LINK for the ***PODCAST*** on JLG and INVESTMENT PHILOSOPHY.If you have any comments or questions, please feel free to email me at bobsadviceforstocks@lycos.com.
Bob
Brief Philosophical Interlude on Investing
This entry isn't about any particular stock at all.

Mt. Fuji
I just want to talk about my view of investing and a methodical approach to building a portfolio.
Investing isn't about screaming and yelling and throwing chairs around and pulling heads off stuffed animals. That's entertainment.
But when you invest, please think about making decisions in a quiet place. A place where you can think clearly and understand what your strategy for investing may entail.
Observe the stock market. Observe stocks. And listen to your portfolio.
When I go through my screens, I am trying very hard to listen to what the stock market is telling me. The stocks that are moving higher are worth consideration from my perspective. But not all stocks that move higher.
Don't stick to any specific strategy. Use all strategies.
The market rewards consistency of earnings and revenue growth. That is the definition of quality.
Believing that a stock is a good "value" is a form of speculation. Albeit a good bet in wise hands. But speculation nonetheless. You are betting that you are wiser than the other investors in the market and can value a stock more accurately than market forces. You may be right. But it is a difficult approach.
An investor that purchases a "beat-up" stock that has declined on bad news is speculating that the market is wrong. It is a high-return investment with lower odds than the low-return investment of purchasing a stock that has consistently been producing quality results.
Go for the 'base hits' and forget the 'home-runs'.
Hedge your bets.
Diversify your investments. Don't sink all of your money into one basket.
Sell your losers quickly and completely and sell your gainers slowly and partially.
Develop a system that allows you to move into and out of the market mechanically. Don't think too much. Let the market dictate your action.
Don't anticipate stock moves. React to stock moves.
Maybe these are just a few words that don't mean much to you. But they form the basis of my thinking. I am not smarter than the market. But maybe my approach is to be more sensitive to market action than the average investor. If so, I shall be successful.
I don't know what the market will do tomorrow, next week or next year. I haven't the foggiest what the DJIA will be. But I am prepared to respond to the market with decisions based on the market action.
Have a great weekend everyone!
Bob
P.S. Please feel free to comment on this right on the blog or email me at bobsadviceforstocks@lycos.com.
JLG Industries (JLG)
Hello Friends! Thanks so much for stopping by and visiting my blog,
Stock Picks Bob's Advice. As always, please remember that I am an amateur investor, so please consult with your professional investment advisors prior to making any investment decisions based on information on this website.

Yesterday, as I
posted on Stock Picks Bob's Advice, I sold a 1/6th position of my Cal Dive (CDIS) holding, and this "entitled" me to make a new purchase (since I was under my 25 position maximum.) That morning, I purchased 160 shares of JLG Industries (JLG) at $51.55/share, for at that time it was on the top % gainers list.
Unfortunately, the market continued to weaken and JLG declined with it. The market is weak again today and JLG is trading at $49.45, down $1.16 on the day for a loss of (2.29)%. Since I haven't written up this stock yet, I wanted to hurry up and get something on the blog before I might even be forced to sell it at an 8% loss! My unrealized loss on this stock as I write is a $(2.10) or (4.1)% since purchase. The stock will need to drop to .92 x $51.55 = $47.43 before I shall neeed to sell at my own 8% loss limit. I am considering adding a new rule to my trading strategy, even if I sell a stock at a gain point, I have "permission" to add a new position
only if the stock market is "up" on the day. What do you think?

Anyhow, let's take a closer look at this company. According to the
Yahoo "Profile" on JLG, the company
"...provides access equipment and highway-speed telescopic hydraulic excavators. The company operates through three segments: Machinery, Equipment Services, and Access Financial Solutions."
I went through my usual screens to come up with this particular company, and let me go over them with you.
First of all, let's take a look for the latest quarterly report. On November 16, 2005, JLG
announced 1st quarter 2006 results. For the quarter ended October 30, 2005, revenue came in at $478 million, a 56% increase over revenue of $307 million the prior year same period. Net income worked out to $27.9 million, or $.53/diluted share, up sharply (over 200%) from the prior year's results of $8.7 million, or $.20/diluted share. The company also raised guidance, as was reported in the same news article:
"In addition, the investments for the recently announced Caterpillar alliance will provide additional capacity for JLG telehandlers beginning in the fourth quarter of fiscal 2006. As a result, we now project revenue growth in the 20 to 25 percent range for fiscal 2006 over 2005, up from our previous guidance of 15 to 20 percent growth.
"With this projected revenue growth, we are raising our targeted fiscal 2006 earnings per diluted share to a range of $2.15 to $2.25 from the previous guidance of $1.95 to $2.05."
Thus we have what I call a "trifecta" in my parlance, for an outstanding earnings report that demonstrates revenue growth, earnings growth, and increased guidance!

My next step in screening for a selection on the blog is to look at Morningstar for a longer-term assessment. Looking at the
Morningstar.com "5-Yr Restated" financials on JLG, we can see that revenue did dip from $1.0 billion in 2001 to a low of $.8 billion in 2003. However, revenue growth has been strong since then climbing to $1.7 billion in 2005 and $1.9 billion in the trailing twelve months (TTM).
Earnings have also been weaker several years ago, falling from $.80/share in 2001, to a loss of $(2.35) in 2002. Since that time, earnings are up sharply to $1.20/share in 2005 and $1.93 in the TTM. Free cash flow has also been improving, with $(121) million in 2003, improving to $(24) million in 2004, $96 million in 2005 and $81 million in the TTM.
The balance sheet looks strong with $230.9 million in cash and $646.7 million in other current assets. This is adequate to cover both the $371.9 million in current liabilities and the $336.3 million in long-term liabilities combined.
My next screen in this process is to look at some valuation numbers. I generally have found Yahoo to be useful for this process, and for JLG, I shall review the
"Key Statistics" page on JLG. Here we find that this stock is a Mid-Cap stock with a market capitalization of $2.56 billion. (I am using the
Ameritrade website definitions which specify a market cap between $500 million and $3 billion for a mid-cap stock.) The trailing p/e is moderate at 26.53, and the forward p/e (fye 31-Jul-07) is downright reasonable at 14.91. Thus the '5 Yr Expected' PEG is pretty cheap at 1.08.
Using the
Fidelity.com eResearch website, we can see that this company has been assigned the Industrial Group of "Farm/Construction Machinery". Within this group, the stock has a moderate Price/Sales ratio of only 1.4. Topping off this list is Joy Global with a Price/Sales ratio of 3.0, JLG at 1.4, Caterpillar at 1.3, Deere at 0.8, and AGCO at 0.3 and CNH Global also at 0.3. Thus, even though the Price/Sales ratio appears cheap out of context, within its industrial group, the stock is rather reasonably priced.
Returning to Yahoo for some additional numbers, we find that there are 51.67 million shares outstanding with 3.15 million shares out short as of 12/12/05. This represents 6.205 of the float or 3.8 trading days (the short ratio). The company pays a small dividend of $.02/share and last split 7/2/96, when the company had a 3:1 stock split.
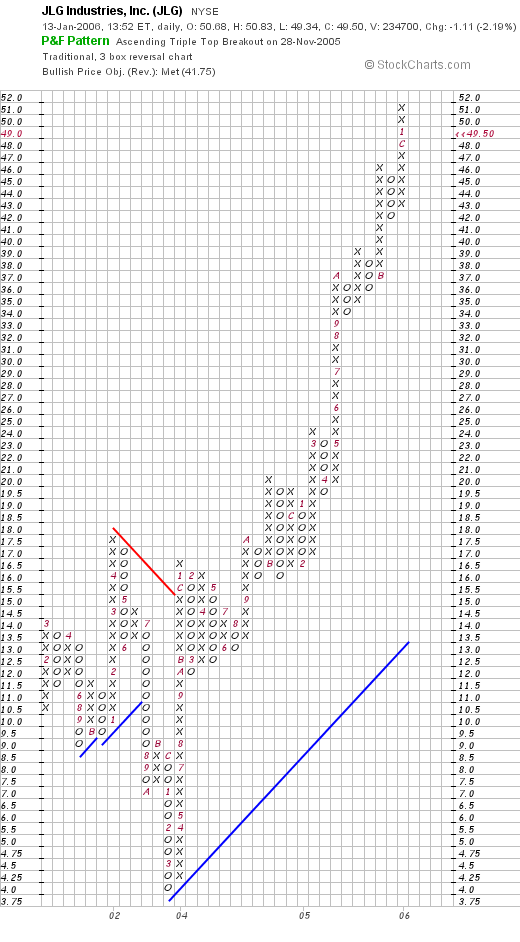
What about a chart? If we take a look at the
"Point & Figure" chart on JLG from Stockcharts.com, we can see how the stock traded lower from March, 2001, at $14.00, down to a low of $4.00/share in March, 2003. Since that time, the stock has been extremely strong, breaking through resistance at $15.50 in November, 2003, to its current $50 level.
So what do I think? Well, I liked it enough to buy some shares! I am down a couple of $'s on the purchase, so I hope that the market holds up and I don't get "shaken out". The timing of these buys might need to be refined a bit :).
Thanks again for visiting! Remember that I am an amateur at all of this. And if you have any question or comments, please feel free to leav ethem on the blog or email me at bobsadviceforstocks@lycos.com.
Bob
Newer | Latest | Older


