Stock Picks Bob's Advice
Saturday, 3 November 2007
"Trading Portfolio Update" November 3, 2007
Hello Friends! Thanks so much for stopping by and visiting my blog, Stock Picks Bob's Advice! As always, please remember that I am an amateur investor so please remember to consult with your professional investment advisers prior to making any investment decisions based on information on this website.
About once a month or so I have been trying to share with you an updated status report on my Trading Portfolio. Most of this is really unnecessary as my participation on Covestor can give you most of the same data. However, Covestor does not provide actual #'s of shares held but rather the composition of the portfolio by %'s. Also, I have been dealing with margin debt in my account and my long-term goal is to eliminate this debt and that kind of information is also not part of Covestor.
Besides, while I do want to have you visit Covestor and check out some of the other portfolios on that website, I do not want to require you now to visit another page to get the information I was providing here previously.
Anyhow, I last reviewed my Trading Portfolio on October 7, 2007. On October 7, 2007, I withdrew $5,000 from the account for miscellaneous expenses. This affected the value of the overall account and should be taken into consideration. I did this earlier this year with a car purchase and have been trying to minimize this activity. (It does not affect my Covestor performance which is still doing just fine thank you, but it does affect the actual, real $ amounts of the value of the account!)
O.K., enough of that. Let's get down to the actual account. Like before, I will list my 15 holdings alphabetically, followed by symbol, number of shares owned, date of purchase, price of purchase, latest price (11/2/07), and percentage unrealized gain (or loss).
Abaxis (ABAX), 210 shares, 10/25/07, $28.29, $29.50, 4.27%
Cerner (CERN), 103 shares, 2/2/07, $49.76, $58.79, 18.14%
Copart (CPRT), 210 shares, 9/27/07, $33.73, $37.13, 10.09%
Covance (CVD), 102 shares, 4/9/07, $62.61, $82.02, 31.0%
US Global Investors (GROW), 10/10/07, 245 shares, $21.27, $22.30, 4.84%
Harris (HRS), 120 shares, 1/31/07, 120 shares, $50.05, $62.26, 24.39%
IHS (IHS), 140 shares, 10/1/07, 140 shares, $58.53, $65.67, 12.20%
Kinetic Concepts (KCI), 140 shares, 10/23/07* (My trade this month in KCI gave me a new basis with the original shares purchased 7/13/07 considered sold), $58.05, $60.66, 4.49%
Morningstar (MORN), 103 shares,11/22/05, $32.57, $73.89, 126.83%
Precision Castparts (PCP), 64 shares, 10/24/06, $69.05, $150.00, 117.23%
ResMed (RMD), 150 shares, 2/4/05, $29.87, $41.90, 40.28%
Universal Electronics (UEIC), 155 shares, 2/23/07, $25.24, $34.22, 35.57%
Meridian Bioscience (VIVO), 199 shares, 4/21/05, $7.42, $32.34, 335.91%
VCA Antech (WOOF), 210 shares, 7/27/07, $41.04, $43.97, 7.14%
Wolverine World Wide (WWW), 200 shares, 4/19/06, $23.55, $24.44, 3.80%
Currently I am at 15 positions, with 20 being my maximum and 5 being my minimum number of holdings. The equity value is $108,391.74, with $(48,854.92) in margin with a total account value of $59,536.82.
My margin equity % has dipped to 54.92% from last month's 57.11%.
As of 11/3/07, I had $25,346.62 in unrealized gains in the account. Since the beginning of this year, I have taken a net of $(630.70) in net short-term gains and $30,885.69 in realized net long-term gains for a total of $30,254.99 in realized gains.
The account has had total income of $380.50 and I have paid a total of $(4,171.02) in margin interest.
Except for my own use of equity funds (drawing off $5,000 this past month for expenses), the account has maintained a solid performance for the year. Let's see if we can get through the last couple of months of this year with this performance intact!
Thanks so much for stopping by and visiting my blog! If you have any comments or questions, please feel free to leave them on the blog or email me at bobsadviceforstocks@lycos.com. If you are interested, be sure and visit my Covestor page where you can monitor my trading portfolio performance and trades on a frequently updated basis. In addition, visit my Stock Podcast website where I discuss some of the stocks I own as well as just write about on the blog.
To see how the blog is performing overall, visit my SocialPicks page which analyzes all of my stock picks for the past year.
Bob
U.S. Global Investors (GROW) "Weekend Trading Portfolio Analysis"

Hello Friends! Thanks so much for stopping by and visiting my blog, Stock Picks Bob's Advice! As always, please remember that I am an amateur investor, so please remember to consult with your professional investment advisers prior to making any investment decisions based on information on this website.
It has been several weeks since I last discussed an actual holding of mine on this blog. In fact, almost a month has passed since I reviewed Covance (CVD) on this blog. Going alphabetically (by symbol) through my list of 15 holdings, I am now up to U.S. Global Investors (GROW).
Let's take a closer look at GROW and I will show you why it still makes sense for my portfolio and whether it still represents an "investable" company.
U.S. GLOBAL INVESTORS (GROW) IS RATED A HOLD
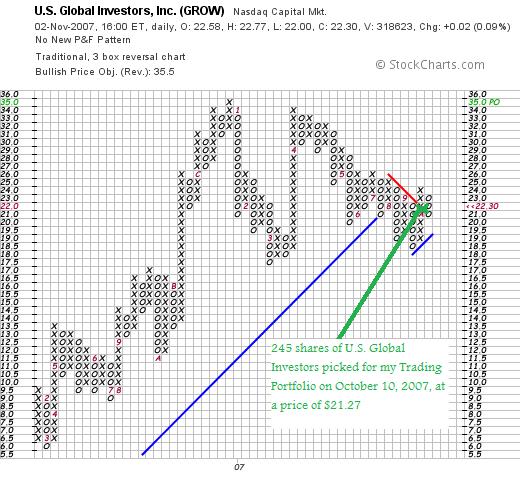
 Currently I own 245 shares of U.S. Global Investors (GROW) that were purchased October 10, 2007, at a cost basis of $21.27. GROW closed 11/2/07 at a price of $22.30, giving me an unrealized gain of $1.03 or 4.8% since my purchase.
When would I sell the stock next?
Assuming the stock continued to appreciate in price, my first targeted sale on the upside is at a 30% appreciation point. For GROW and my purchase, this represents a price of 1.30 x $21.27 = $27.65. At that point I would plan on selling 1/7th or 245/7 = 35 shares. If the stock should decline sufficiently, I shall sell all of my shares. Since I haven't sold the stock yet at a gain, the price on the downside remains at an 8% loss limit, or .92 x $21.27 = $19.57.
What exactly does this company do?
According to the Yahoo "Profile" on GROW, the company
"...through its wholly owned subsidiaries, provides mutual fund management services. It provides investment advisory services to institutions and individuals; transfer agency and record keeping services; mailing services; and distribution services to mutual funds advised by the company. The company primarily invests in early-stage or start-up businesses."
How did they do in the latest quarter?
 On September 12, 2007, GROW announced 4th quarter 2007 results. Revenue for the quarter ended June 30, 2007, came in at $21.83 million up from $18.96 million the prior year. Net income was reported at $6.41 million or $.41/share, up from $5.62 million or $.37/diluted share the prior year.
Assets under management increased 33.9% from the prior year to $4.61 billion from $3.44 billion the prior year same period.
In another vote of confidence for the stock, GROW doubled the monthly dividend to $.02/share from $.01/share.
How about longer-term results?
Reviewing the Morningstar.com "5-Yr Restated" financials on GROW, we find that revenue has dramatically increased from $7.5 million in 2003 to $58.6 million in 2007. Earnings have also increased from $0 in 2003 to $.20/share in 2004, dipped to $.10/share in 2005, then rebounded to $.70/share in 2006 and $.90/share in 2007. Meanwhile, shares have been stable at 15 million since 2003. The company does pay a dividend which is listed at $.30/share in the trailing twelve months (TTM).
Free cash flow has also grown from $1 million in 2005 to $5 million in 2006 and $8 million in 2007.
The balance sheet appears solid with $15 million in cash, which by itself could easily pay off the current liabilities of $8.7 million. No long-term liabilities are reported. In addition, the company has another $22 million in other current assets.
What does the chart look like?
Taking a look at the "point & figure" chart on GROW from StockCharts.com, we can see that the stock has had a strong run from the $6.00 range in March, 2006, to a high at $35 in December, 2006. Unfortunately, the stock has not exceeded that high, even after a strong run in April, 2007. Currently, the stock has broken through the main support line at $21 in July, 2007, and is struggling to find new support to move higher.
I am not prepared to sell the stock at this time and am awaiting the soon to be announced earnings for the first quarter of fiscal 2008. The earnings reported last quarter were strong, the Morningstar.com report was strong, but the chart doesn't inspire me to think too confidently about this stock. Thus the "hold" rating.
Thanks for stopping by and visiting my blog! If you get a chance, be sure and visit my Stock Picks Podcast Page, my Covestor Page, and my SocialPicks Page. The Podcast is a companion to my blog, the Covestor site is useful as an analysis of my actual Trading Portfolio (including this stock) and my SocialPicks page is a general overview of all of my stock picks the past year.
If you have any comments or questions, please feel free to leave them on the blog or email me at bobsadviceforstocks@lycos.com.
Bob
Posted by bobsadviceforstocks at 4:55 PM CDT
|
Post Comment |
Permalink
Updated: Saturday, 3 November 2007 4:59 PM CDT
"Looking Back One Year" A review of stock picks from the week of May 8, 2006

Hello Friends! Thanks so much for stopping by and visiting my blog, Stock Picks Bob's Advice! As always, please remember that I am an amateur investor, so please remember to consult with your professional investment advisers prior to making any investment decisions based on information on this website.
This is usually the place I review stock picks. But I didn't pick any stocks during the week of May 8, 2006. I could, I suppose, skip a week ahead. But when given the opportunity to skip anything, well you know how that goes :).
It is a great autumn day to get outside and appreciate the beautiful colors of nature. This is a photo I found of Wiesbaden, Germany.

Have a great weekend everyone! I shall try to get another post up later today or tomorrow!
Bob
Friday, 2 November 2007
Mettler Toledo International (MTD) and an article about Martin Zweig!
Hello Friends! Thanks so much for stopping by and visiting my blog, Stock Picks Bob's Advice! As always, please remember that I am an amateur investor, so please remember to consult with your professional investment advisers prior to making any investment decisions based on information on this website.
The stock market sure has been volatile the past few days. I cannot tell you how many times I felt like selling a position just because it didn't 'feel right'. Fortunately I have a very well-defined strategy of buying and selling stocks and can depend on it to keep me from making a quick move that I might regret later.
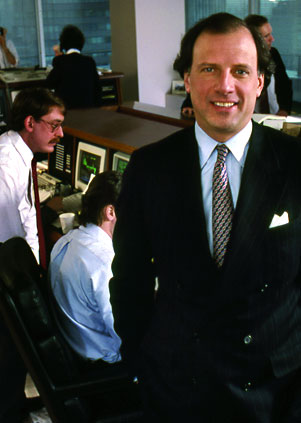
I found an interesting article about Martin Zweig that caught my eye today.
(Here is a picture of Mr. Zweig from the Wharton Alumni Magazine)
 The article discusses Mr. Zweig's approach to picking stocks. I share many of the same beliefs about investing. Let me share with you what the article had to say:
"Focus on earnings
In his analysis of individual stocks, Zweig is first and foremost concerned with the company's earnings. "I don't get that much involved in the product being produced," he wrote in Winning on Wall Street. "If a company can show nice consistent earnings for four or five years, I don't care if it makes broomsticks or computer parts."
Unlike many investors, however, Zweig doesn't simply look at earnings growth over one fixed period; instead, he dissects a company's earnings from a variety of different angles, trying to find firms that have shown steady and "reasonable" long-term growth that has been accelerating in recent quarters. I've broken his earnings analysis down into two main categories below.
- Long-term earnings: These criteria include long-term earnings per share growth and "earnings persistence". To show sufficient long-term growth, a company must have increased its EPS by an average of 15 percent per year, with long-term growth of 30 percent or more the best case. To show "earnings persistence", meanwhile, it must have increased its EPS in every year for a five-year period.
A good example of a stock that meets these standards is American clothier Aeropostale (NYSE:ARO), a New York-based mid-cap ($1.52 billion market cap) whose 700-plus stores sell a variety of casual clothing targeted at 14- to 17-year-olds. Aeropostale has a long-term growth rate of 32.37 percent (based on the average of its three-, four-, and five-year EPS figures). What's more, its per-share earnings for the past five years have been $0.36, $0.62, $0.98, $1.00, and, most recently, $1.32, showing the kind of continuous increases that pass this test. •
- Recent earnings: Zweig wants the current quarter's earnings to be positive, and wants the current quarter growth (over the same quarter last year) to be positive. But he doesn't just want to see growth; he also wants the rate of growth to be accelerating. He doesn't want to jump on the train too late, after earnings growth has peaked."
I believe that Mr. Zweig is right on the money about investing. At least that is my own philosophy as well. I don't think there is anything magical about picking stocks for a portfolio. It is important to narrow down your universe of acceptable stocks (what I call my "vocabulary of stocks") and have some sort of system that assists you in determining when you should be buying and when you should be selling.
The article continues with some suggestion about examining the underlying fundamentals behind each stock investment:
"The P/E ratio: A different take
Like many investors, Zweig also focuses on the P/E ratio. But unlike most others, he doesn't just target stocks with low P/E figures. In fact, to Zweig there is such a thing as a P/E that is too low. His reasoning: a very low P/E may be very low for a reason -- that the company is weak and doesn't have the ability or potential to command higher share prices from investors. The model I base on his approach thus requires stocks to have P/Es greater than 5, to protect against such weak companies.
Because he targets companies with steady and reasonable growth -- the type of companies that aren't likely to go unnoticed on Wall Street -- Zweig is willing to buy stocks with above-average P/E ratios. Still, there is a point at which price can get too high relative to earnings for him, and the model I base on his writings sets that upper limit at three times the market average. As a way to make sure that the market itself isn't too overpriced, this model also sets an absolute limit of 43 for a company's P/E ratio.
Currently, the market P/E is 19.0. Aeropostale, meanwhile, has a P/E of 13.2, based on trailing 12-month earnings, passing this test.
Don’t forget sales, debt, and insiders
It's important to note that, while Zweig focuses a good deal on earnings, he acknowledges that earnings sometimes don't tell the whole story. In order to keep growing over the long-term, Zweig believes that earnings must be accompanied by a comparable or better increase in sales; cost-cutting measures are fine, but by themselves they can't sustain good growth over the long haul."
In addition, Zweig examines debt as well as insider transactions. (I haven't been using insider trades as an indicator but it is worth considering!)
"Another factor that can make good earnings misleading, Zweig says, is debt. A lot of debt means a company has significant fixed interest payments, and if business slows, those payments can whittle away profits. Zweig makes a very smart point here: that debt levels vary by industry. The model I base on his approach thus makes sure that a company's debt/equity ratio is less than its industry average. In this regard Aeropostale excels: While other retail apparel firms average 48.95 percent debt/equity ratios, Aeropostale has no debt.
One final Zweig-based category: insider transactions. Zweig believes that those who work for a company know the business best. If a lot of them are selling their shares, and no one buying shares, it could mean trouble; conversely, if a lot of them are buying, but no one selling, it could bode well."
Finally Zweig also knew when it was important to sell a stock. He set limits on his purchases.
"One final key part of Zweig's approach is his belief in stop-losses, which I don't include in my model. Essentially, Zweig set downside limits on his investments, and if the stock ever fell to these levels, it was automatically sold, as a means to limit losses."
Does all of this sound familiar? I do not claim to be in the same league as a Martin Zweig. But we can all learn from the best investors out there. I hope you enjoyed the comments.
Since I have been a bit verbose this evening, I shall try to stay brief and share with you why I believe Mettler Toledo International (MTD) deserves a spot on this blog. (I suspect that Marty Zweig might even like this one as well!)
METTLER TOLEDO INTERNATIONAL (MTD) IS RATED A BUY
 I was looking through the list of top % gainers on the NYSE today and came across Mettler Toledo (MTD). Mettler Toledo closed today at $112.52, up $7.41 or 7.05% on the day. I do not own any shares of this stock nor do I have any options.
 What exactly does this company do?
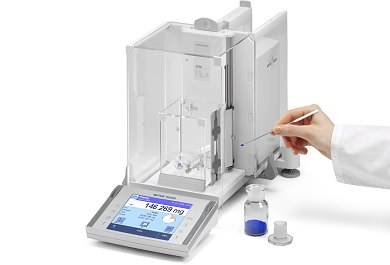
According to the Yahoo "Profile" on MTD, the company
"...supplies precision instruments and services worldwide. It offers various laboratory and industrial instruments, and retail weighing instruments for use in laboratory, industrial, and food retailing applications."
How did they do in the latest quarter?
Much like a 'broken-record', I shall explain that the company made a big move higher today after a strong earnings report after the close of trading yesterday! On November 1st, the company announced 3rd quarter 2007 results. For the quarter ended September 30, 2007, sales growth was 7% in 'local currency' with sales coming in at $442.6 million, up from 4397.3 million. GAAP earnings were flat at $1.16/share in both 2007 and 2006, but adjusting for 'one-time items', adjusted EPS in 2007 was $1.15, up 24% over the prior year amount of $.93/share.
The company beat expectations of $1.06/share for the quarter.
What about longer-term financial results?
If we review the "5-Yr Restated" financials on MTD from Morningstar.com, we can see that first of all the company has been consistently growing its revenue from $1.2 billion in 2002 to $1.6 billion in 2006 and $1.7 billion in the trailing twelve months (TTM).
Earnings during this period did dip from $2.20/share to $2.10/share between 2002 and 2003, then since then have steadily increased to $3.90/share in 2006 and $4.30/share in the TTM.
No dividend is reported, but the outstanding shares were even better than stable, they actually were decreased from 44 million in 2002 to 42 million in 2005 and 40 million in 2006 and 2007.
Free cash flow has been solidly positive and growing the past several years with $138 million in 2004, $145 million in 2005, $157 million in 2006 and $173 million in the TTM.
Meanwhile, the balance sheet appears solid with $100 million in cash and $533 million in other current assets. This total of $633 million in current assets, when compared to the $378.7 million in current liabilities yields a current ratio of 1.67. The company also has a moderate amount of long-term liabilities listed at $588 million.
What about some valuation numbers?
Yahoo "Key Statistics" on Mettler Toledo are helpful in providing us with some valution numbers. With a market capitalization of $4.18 billion, MTD should be considered a large mid-cap stock!
The trailing p/e is a moderate 25.98 with a forward p/e of 22.73 (fye 31-Dec-08). The PEG works out to a bit rich at 1.85.
Valuation-wise, from the Fidelity.com eresearch website, we can see that the Price/Sales (TTM) ratio is a very reasonable 2.39, compared to the industry average of 4.10. The company is also quite profitable compared to its peers with a Return on Equity (TTM) of 27.91% compared to the industry average of 8.01%.
Finishing up with Yahoo, there are 37.18 million shares outstanding with 32.2 million that float. As of 9/25/07, there were 84,560 shares out short, not representing much of a short interest, with 0.5 trading days of volume (the short ratio). No dividend is paid and no stock split is reported on Yahoo.
What does the chart look like?
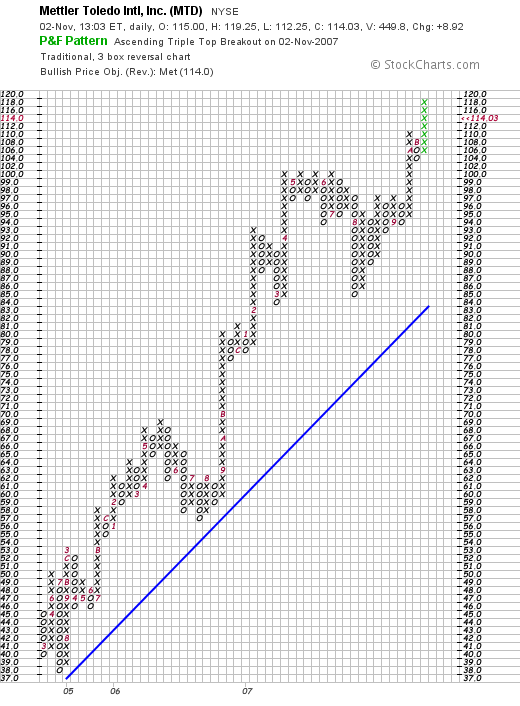
Examining the "point & figure" chart on Mettler Toledo (MTD) from StockCharts.com, we can see what I would have to call a gorgeous picture of stock price appreciation with a rather steady rise in price from a low of $38 in July, 2004, to a recent high near $116.
Summary: What do I think?
Needless to say I like this stock a lot! This is my kind of company with persistence of earnings, persistence of revenue growth, increasing free cash flow, a slightly decreasing outstanding shares, and a solid balance sheet. With the great technical chart, what is there not to like?
I am not in a position to be buying any shares of anything, so I shall be keeping this stock in my 'vocabulary' of investable stocks.
Thanks again for stopping by! If you have any comments or questions, please feel free to leave them on the blog or email me at bobsadviceforstocks@lycos.com. If you get a chance, be sure and visit my Covestor Page where my Trading Portfolio is analyzed, my SocialPicks page where my stock picks are evaluated, and my Stock Picks Podcast website, where I discuss many of these same stocks I write about on the blog!
Have a great weekend everyone!
Bob
Wednesday, 31 October 2007
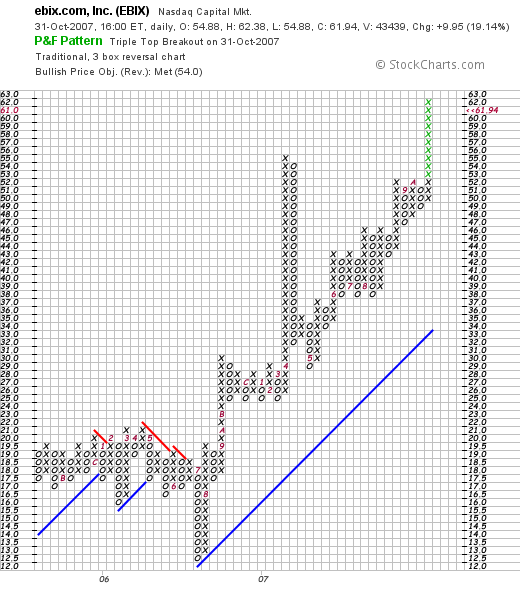
Ebix (EBIX)
 Hello Friends! Thanks so much for stopping by and visiting my blog, Stock Picks Bob's Advice! As always, please remember that I am an amateur investor, so please remember to consult with your professional investment advisers prior to making any investment decisions based on information on this website.
First of all, Happy Halloween to all of my good friends out there in internetland! (I found this great picture of pumpkins from Iron Kettle Farm in New York!) Don't eat too much candy tonight!
It was more treat than trick from the Fed today. A quarter-point cut in the federal funds rate was enough to push stocks higher with the Dow closing at 13,930.01, up 137.54, and the Nasdaq closing at 2,859.12, up 42.41 and the S&P 500 closing at 1,549.38, up 18.36 on the day.
With a strong day in the market today, I figured it would be easy to find one of 'my kind of stocks' moving higher, and I wasn't disappointed!
 Checking the list of top % gainers on the NASDAQ today, I came across Ebix Inc. (EBIX), which closed at $61.94, up $9.95 or 19.14% on the day. I do not own any shares nor do I have any options on this stock. Let's take a closer look at this stock and I will explain why I think it deserves a spot on my blog and why
EBIX (EBIX) IS RATED A BUY
What exactly does this company do?
According to the Yahoo "Profile" on Ebix, the company
"... provides software and Internet-based solutions for the insurance industry. It focuses on the sale, customization, development, implementation, and support of its insurance carrier system product, known as Business Reinsurance and Insurance Company System (BRICS)."
How did they do in the latest quarter?
This morning before the opening of trading, EBIX announced 3rd quarter 2007 results. Revenue for the quarter ended September 30, 2007, came in at $11.81 million, a 62% increase over last year's $7.3 million figure. Net income came in at $3.69 million up 123% from $1.66 million or $1.00/diluted share, up from $.53/diluted share last year.
The 'street' saw this phenomenal result and bid up the price today accordingly!
How about longer-term results?
Checking the Morningstar.com "5-Yr Restated" financials on EBIX, we find that the company over the past 5 years has steadily grown revenue from $13 million in 2002 to $29 million in 2006 and $35 million in the trailing twelve months (TTM). Earnings have increased from $.20/share in 2002 to $1.90/share in 2006 and $2.40/share in the TTM. Meanwhile, the outstanding shares have increased from 2 million in 2002 to 3 million in the TTM.
Free cash flow has been positive and growing from $2 million in 2004, $5 million in 2005, $4 million in 2006 and $6 million in the TTM. The balance sheet, while numbers are small, is quite solid with $12 million in cash, which alone could pay off both the $10 million in current liabilities and the $700,000 in long-term liabilities combined. Calculating the current ratio, the company has $23 million in total current assets, which when divided by the $10 million in current liabilities yields a very satisfactory 2.3 figure.
What about some valuation numbers?
Reviewing the Yahoo "Key Statistics" on EBIX, we can see that this is a small cap stock with a market capitalization of only $202.48 million. The trailing p/e is moderate at 25.50, especially considering the remarkable growth in earnings just recorded. Without any estimates, we cannot calculate the PEG ratio.
Using the Fidelity.com eresearch website, we can see that in terms of the Price/Sales (TTM) ratio, the stock is reasonably valued with a ratio of 4.15 compared to the industry average of 7.54. The company is not quite as 'profitable' as its peers in terms of the Return on Equity (TTM) figure which comes in at 25.33% compared to the industry average of 33.64%.
Finishing up with Yahoo, we can see that there are only 3.27 million shares outstanding with 2.83 million of them that float. As of 10/10/07, there were 3,320 shares out short representing 1 trading day of volume or 0.1% of the float.
No dividends are reported on Yahoo and the last split was actually a reverse stock split of 1:8 reported on October 1, 2002.
What does the chart look like?
Reviewing the "Point & Figure" chart on EBIX from StockCharts.com, we can see that the stock traded fairly 'sideways' between October, 2005 until August, 2006, beetween $20 and a low of $12.50. During the month of August, 2006, the stock broke out to the upside and has been moving strongly higher from this $20 level to the current $60 level where it is currently trading. This chart looks strong, if a bit over-extended, to me.
Summary: What do I think?
I actually first commented briefly on EBIX on May 24, 2007, when Doug S., a great reader and commenter on this blog wrote me about MLAB. This however, is my first in depth examination. I certainly like this stock and this company.
The company certainly reported terrific results. Blow-out growth in terms of both revenue and earnings expansion. A five year record of steady growth in revenue, earnings, positive free cash flow all while maintaining a very stable number of shares outstanding and a solid balance sheet. The stock is rather thinly traded and this can increase volatility both on the upside as it demonstrated today, or even on the downside as any large investor tries to unload shares. That is the underlying problem with purchasing shares in rather small companies which can also work to your advantage!
 Thanks again for stopping by and visiting my blog. If you get a chance be sure and visit my Stock Picks Podcast Website, and you can listen to me ramble on about a few of the many stocks that I write up here on the blog. Check out my Covestor Page where Covestor has been analyzing my actual trading portfolio, and my SocialPicks Page where SocialPicks has been following my stock picks from this blog since the first of this year.
If you are so inclined, drop by and visit Prosper.com where I am starting to dip my toes into the water of personal lending eBay style. Be aware of the risks of these person-to-person unsecured loans, as well as the opportunities of higher interest rate returns on your investment.
Thanks again for visiting! Here is some candy corn for all of you 'Trick or Treaters!'. Enjoy the holiday and stay safe!
Bob
Tuesday, 30 October 2007
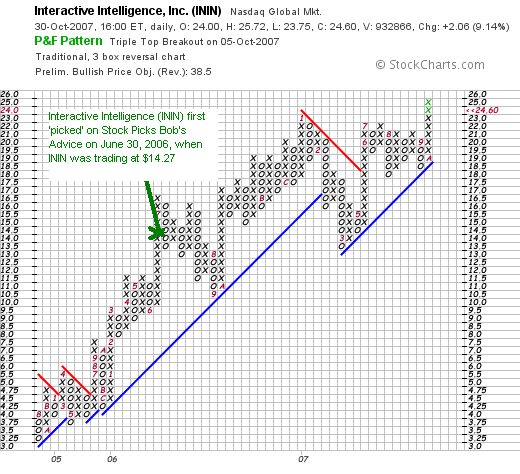
Interactive Intelligence (ININ) "Revisiting a Stock Pick"
Hello Friends! Thanks so much for stopping by and visiting my blog, Stock Picks Bob's Advice! As always, please remember that I am an amateur investor, so please remember to consult with your professional investment advisers prior to making any investment decisions based on information on this website.
 I wanted to give a brief post this afternoon on Interactive Intelligence (ININ) and why I think
INTERACTIVE INTELLIGENCE (ININ) IS RATED A BUY
First of all, ININ had a great day today in an otherwise mediocre market. ININ made the list of top % gainers on the NASDAQ, closing at $24.60, up $2.06 or 9.14% on the day. I do not have any shares nor do I have any options on this stock.
This is a 'revisit' for me, as I first posted Interactive Intelligence on Stock Picks Bob's Advice on June 30, 2006, when the stock was trading at $14.27.
Here is the 'point & figure' chart on ININ from StockCharts.com with my purchase price/date highlighted:
A couple more points to make. ININ reported their
3rd quarter 2007 results yesterday after the close of trading. Disregarding a one-time tax benefit in 2006, revenue came in at $28.7 million for the current quarter, up 29% over revenue of $22.2 million in 2006. Operating income climbed 23% to $2.1 million from $1.7 million in 2006 and non-GAAP earnings were $.17/share this quarter vs. $.12/share last year (taking out the one-time gain in 2006.)
The company beat expectations as analysts, according to Thomson Financial, expected profit of $.12/share on revenue of $26.9 million.
Finally, the Morningstar.com '5-Yr Restated' financials appear quite solid, with steady revenue growth, steady earnings growth, stable outstanding shares, steady improvement in free cash flow, and a solid balance sheet with no long-term liabilities reported at all.
This is the kind of stock I would be buying if I were buying shares today. In any case, thanks for dropping by! If you have any comments or questions, please feel free to leave them on the blog or email me at bobsadviceforstocks@lycos.com. Be sure and visit my Stock Picks Podcast page, my Covestor page where my trading portfolio is analyzed, and my SocialPicks page where that website assesses the quality of my stock picks--at least since early this year.
Bob
Saturday, 27 October 2007
"Looking Back One Year" A review of stock picks from the week of May 1, 2006
Hello Friends! Thanks so much for stopping by and visiting my blog, Stock Picks Bob's Advice! As always, please remember that I am an amateur investor, so please remember to consult with your professional investment advisers prior to making any investment decisions based on information on this website.
It sounds trite to comment that I am amazed that it is the weekend once again and it is time to write up some reviews. I don't know about you, but my weeks are so busy with work and family that I seem to turn around and there goes another week, another month, another year.
Anyhow, it is a beautiful fall day here in Wisconsin. I had a little time to get outside and wrap some of our smaller trees with some PVC so that the deer don't abuse them too badly. Maybe you don't have deer near where you live. But they come down out of a nearby woods and eat everything in sight. Beautiful animals. But boy what an appetite!
Oh I am digressing once again. I suppose you came here to find out about stocks and not about my garden adventures :). But what I do here on weekends is to write up reviews of past stock picks. It is enough to more or less shoot my mouth off about different stocks on this blog, but the responsibility to you, the reader, requires me to dig back into my past entries and find out how all of those stocks turned out. Hopefully, from this analysis, we can identify in some fashion what criteria appear to be working and what aren't. Last week I reviewed stocks from the week of April 24, 2006. Let's move a week ahead and take a look at the stocks "picked" during the week of May 1, 2006.
As I also like to point out to all of you readers, is that these reviews assume a buy and hold strategy for investing. In fact, I practice and employ a disciplined selling strategy that requires me to sell stocks if they incur small losses

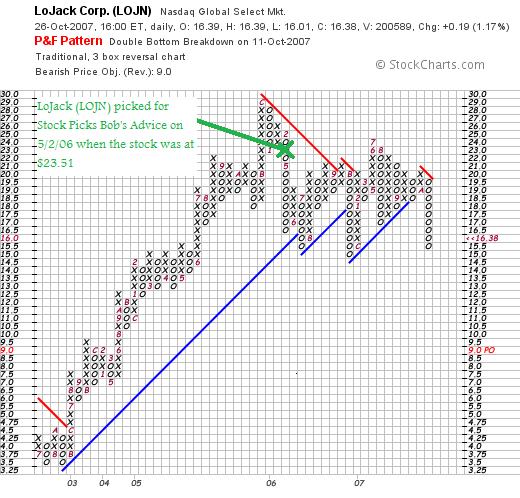
On May 2, 2006, I posted LoJack on Stock Picks Bob's Advice when the stock was trading at $23.51. LOJN closed at $16.38 on October 26, 2007, for a loss of $(7.13) or (30.3)% since posting.
On August 1, 2007, LoJack (LOJN) announced 2nd quarter 2007 results. Revenue for the quarter ended June 30, 2007, climbed 3% to $58.2 million from $56.7 million in the same quarter the prior year. Net income was up 22% to $6.7 million or $.35/diluted share from $5.5 million or $.29/diluted share the prior year.
The Morningstar.com "5-Yr Restated" financials page is intact.
However, with the anemic growth in revenue from the latest quarterly report, the weak-appearing 'point & figure' chart from StockCharts.com,
LOJACK (LOJN) IS RATED A HOLD

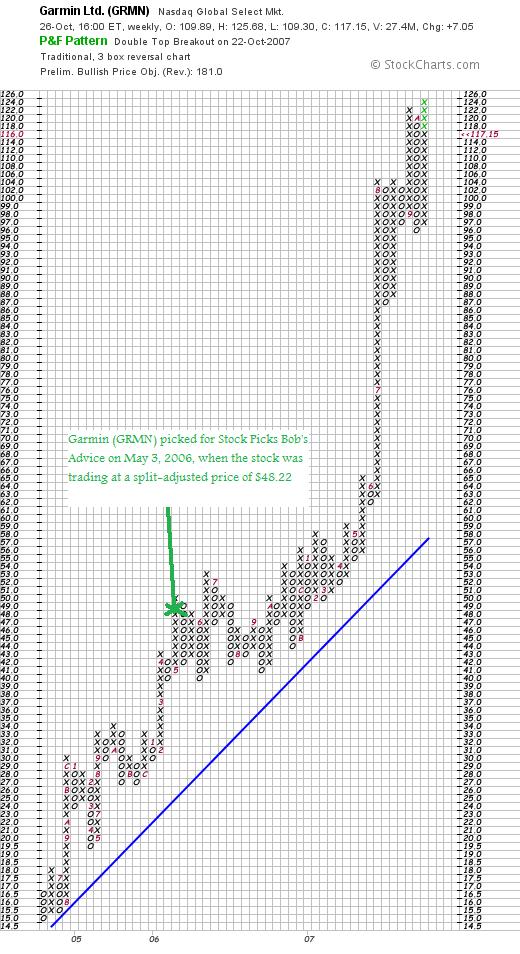
On May 3, 2006, I posted Garmin (GRMN) when the stock was trading at $96.43. Garmin stock split 2:1 on August 16, 2006, making my effective stock price actually $48.22. Garmin closed at $117.15 on October 26, 2007. This gives my pick a gain of $68.93 or 142.9% since posting.
On August 1, 2007, Garmin (GRMN) announced 2nd quarter 2007 results. Revenue came in at $742 million, up 72% from $433 million in the same quarter the prior year. Net income, excluding foreign currency translation, increased to $219.6 million, up sharply from $120.8 million the prior year. Net income per diluted share (GAAP) came in at $.98/share, up from $.56/share last year.
Garmin beat expectations with earnings of $.98/share (analysts were expecting $.74/share) and came in with revenue of $742.5 million (analysts were expecting revenue of $645.7 million per Thomson Financial.)
The company also raised guidance for 2007 to earnings above $3.15/share on revenue of at least $2.8 billion. Analysts have been projecting earnings of $2.90/share on revenue of $2.62 billion.
With the fabulous quarterly report, the strong 'point & figure' chart from StockCharts.com and the beautiful Morningstar.com "5-Yr Restated" financials page,
GARMIN (GRMN) IS RATED A BUY
 On May 6, 2006, I 'revisited' CNS (CNXS) when the stock was trading at $24.14. CNXS was purchased by GlaxoSmithKline plc on December 19, 2006, for $37.50 in cash. This represented a gain of $13.36 or 55.3% since my 'pick'.
Since CNS (CNXS) is no longer traded, I do not have an opinion on this stock :).
So how did I do that week back in May, 2006. Pretty darn good actually! I had one stock pick decline moderately, one that shot to the moon, and one that made a very nice move and got acquired in the process! On average, these three stocks had a gain of 56.0% since posting.
Please remember that past performance is not a guarantee or a reliable indicator of future performance, but it was a pretty good performance, don't you think?
Thanks again for visiting! If you get a chance be sure and visit my Covestor Page where my actual trading portfolio is reviewed and my SocialPicks page where all of my picks from the first of the year have been evaluated, and don't forget to visit my Podcast Page, and if I get a chance I shall be doing a podcast this week!
Have a great week trading!
Bob
Posted by bobsadviceforstocks at 2:29 PM CDT
|
Post Comment |
Permalink
Updated: Sunday, 28 October 2007 9:24 PM CDT
Graham Corporation (GHM) "A Reader Suggests a Stock Pick!"
Hello Friends! Thanks so much for stopping by and visiting my blog, Stock Picks Bob's Advice! As always, please remember that I am an amateur investor, so please remember to consult with your professional investment advisers prior to making any investment decisions based on information on this website.
 I am very fortunate to have readers like Doug S., who regularly drops me a line with mostly great ideas and comments. I cannot answer all of his emails, and I look forward to his and any you may write, just drop me a line at bobsadviceforstocks@lycos.com if you would like to email me.
Doug generally seems to invest and pick stocks much in the same fashion as I have been doing. He wrote me an email this morning about a stock that I believe deserves a spot on this blog. He wrote:
"GHM....I took a page out of both our books when I purchased this mid session yesterday. Talk about relative strength/momentum; talk about earnings; talk about no shorts or analysts to mess things up; what's not to
love? This should go to the moon!"
 Well Doug, I don't know if this stock will go as high as the cow that jumped over the moon but I really liked the numbers so let's take a closer look at this stock and I will share with you and my readers why I agree that this is the kind of stock that may well reach stellar heights :).
First of all, I guess that Doug owns shares of Graham (GHM) as per his letter. I personally do not own any shares nor do I have any options on this stock. Graham (GHM) indeed had a fabulous day yesterday closing at $58.25, up $12.65 or 27.74% on the day!

Let's review the stock and I will show you why
GRAHAM CORPORATION (GHM) IS RATED A BUY
What exactly does this company do?
According to the Yahoo "Profile" on Graham (GHM) the company
"engages in the design, manufacture, and sale of vacuum and heat transfer equipment used in the chemical, petrochemical, petroleum refining, and power generating industries worldwide. Its products include steam jet ejector vacuum systems; surface condensers for steam turbines; vacuum pumps and compressors; various types of heat exchangers, including helical coil heat exchangers marketed under the Heliflow name; and plate and frame exchangers. These products are available in various metal and non-metallic corrosion resistant materials."
How did they do in the latest quarter?
Like so many of the entries on this blog, it was the announcement of quarterly earnings that drove this stock price higher. Friday, October 26, 2007, before the opening of trading, Graham (GHM) announced 2nd quarter 2008 results.
For the quarter ended September 30, 2007, revenues came in at $23.1 million, a 45% increase over last year's $15.9 million result. Net income for the quarter came in at $4.4 million up over 600% from last year's $563,000. On a per diluted share basis this worked out as $1.10, up over 600% from last year's $.14/share. The market liked what it read and bid the stock price up strongly on Friday!
To add to the enthusiasm behind investors' pursuit of this stock was the announcement of a 5:4 stock split in the form of a 25% stock dividend and the increase in the dividend to an after-split $.03/share amount.
What about longer-term results?
For this information, let's take a look at the "5-Yr Restated" financials on Graham (GHM) from Morningstar.com. Here we can see that the company actually had a dip in revenue from 2003 when they had $45 million in sales to $38 million in 2004. However, since 2004, revenue has steadily improved to $66 million in 2007 and $71 million in the trailing twelve months (TTM)
Earnings, which showed a loss in 2004 of $(.40), dipped even further to a $(.90)/share loss in 2005, then turned profitable at $1.00/share in 2006, increased to $1.50/share in 2007 and $1.80/share in the TTM. The company has paid dividends at $.10/share since 2003 and as reported above, is now increasing its dividend as well. The outstanding shares have been very stable with 3 million reported in 2004, and increasing to 4 million in the TTM.
Free cash flow which was negative at $(1) million in 2004 and $(5) million in 2005, turned positive at $5 million in 2006, $4 million in 2007, and $11 million in the TTM.
The balance sheet is solid with $1 million in cash and $40 million in other current assets, easily covering the $16.3 million in current liabilities yielding a current ratio of 2.52.
What about some valuation numbers?
Reviewing the Yahoo "Key Statistics" on Graham (GHM), we find that this is a small cap stock with a market capitalization of only $227.82 million. The trailing p/e is a moderate 31.59, with a forward p/e (fye 31-Mar-09) estimated at 23.87. No PEG is reported.
According to the Fidelity.com eresearch website, the company is quite profitable with a return on equity (TTM) of 33.89, compared to an industry average of 22.39%.
Finishing up with Yahoo, we again see that there are 3.91 million shares outstanding with 3.62 million of them that float. As of 10/10/07, there were only 4,170 shares reported out short representing a short ratio of only 0.1. As also noted, the company pays a dividend of $.10/share (to be increased) yielding 0.2%. The last stock split was a 2:1 stock split back on October 4, 2005.
What does the chart look like?
Reviewing the 'point & figure' chart on Graham (GHM) from StockCharts.com, we can see that the stock really traded sideways between July, 2005 and May, 2007, when the stock was stuck in a trading range between $12 and $19.50. However, in May, 2007, the stock broke out of this range and moved higher from the $18 level to its current level near $60.

Summary: What do I think?
Well, I think that Doug has once again introduced me to a great stock that fits all of my own peculiar criteria for stock selection. The company had a great move higher yesterday, terrific earnings announced with an increased dividend and stock split to top it off, and has a several year history of solid growth. On top of this, the chart looks very strong, and I do like these companies on the AMEX that seem to escape attention like Bolt (BTJ) until they announce a superb quarter and everyone tries to pile on to the stock which in this case, doesn't have many shares outstanding anyhow.
Thanks again for commenting, visiting, and contributing to the blog Doug!
And thanks to all the rest of you for visiting!
If you have any comments or questions, please feel free to leave them right on the blog or email me at bobsadviceforstocks@lycos.com. If you get a chance, be sure and visit my Podcast Site, or my Covestor page where my actual trading portfolio is monitored and evaluated, or my SocialPicks page where my stock picks from the first of the year are monitored.
Finally, if you have any interest in a different sort of investment vehicle, visit Prosper.com where you can bid on unsecured loans and earn above-average interest rates. This eBay style website was started by the E-Loan founder, but does have very significant risks involved. So be careful, spread out your risk by lending in multiple loans, stick to higher rated loans for less risk, and be aware of the potential of loss!
(I know that some of you readers have indeed signed up and I thank you for doing so. Please share with me and with my readers your experiences with Prosper.com so that we all can develop a better feel for the potential of this site as well and the risks and benefits entailed.)
I hope you all are having a wonderful weekend. If I get a chance, I shall get to my 'weekend review' and perhaps check out one of my actual holdings to see how things are doing in that department.
Regards.
Bob
Thursday, 25 October 2007
Covance (CVD), Kinetic Concepts (KCI), and Abaxis (ABAX) "Trading Transparency"
Hello Friends! Thanks so much for stopping by and visiting my blog, Stock Picks Bob's Advice! As always, please remember that I am an amateur investor, so please remember to consult with your professional investment advisers prior to making any investment decisions based on information on this website.
I wanted to get this quick update out today, but one thing led to another, and you know the story! Anyhow, my Covance stock hit a sale point and I sold 1/7th of my 119 shares or 17 shares today at $83.67. These shares were originally purchased 4/9/07 at a cost basis per share of $62.61. Thus, this represented a gain of $21.06 or 33.6% since purchase.
COVANCE (CVD) IS RATED A BUY
If you are new to my strategy, I sell my gaining stocks slowly and partially--currently selling 1/7th of my remaining shares---at targeted appreciation points. I use gains at 30, 60, 90, 120, 180, 240, 300, 360, 450%...etc. as points to sell shares. I also use these sales as "signals" that the market is more or less 'healthy' and that I have 'permission' to add a new position if I am below my maximum holding. Thus, being at 14 positions, below my maximum of 20, I set out to find a new holding.
With a lot of my assets tied up in my KCI position, I figure I had made my point with the stock up about a point, and unloaded my additional 280 shares of KCI at $59.07. I had purchased these shares at $58 the prior day and if I didn't have as heavy a margin level as I do, I would maybe hang in there, but I wanted to add that 'new position' and went ahead and sold with a small gain.
KINETIC CONCEPTS (KCI) IS RATED A BUY
Looking through the list of top % gainers today, I came across an old favorite, Abaxis (ABAX), which closed at $29.38, up $5.19 or 21.46% on the day today. I purchased 210 shares today when the stock was trading at $28.24, so I also made about a point already on this purchase. ABAX stock was up strongly today on the back of 2nd quarter 2008 results that were announced after the close of trading yesterday.
ABAXIS (ABAX) IS RATED A BUY
I mention "old favorite" on Abaxis, as I recently wrote up the stock on January 27, 2007, when the stock was trading at $20.57. This was not my first review, as I also discussed Abaxis on September 26, 2003, when the stock was trading at $13.40.
Thanks so much for stopping by and visiting! If you have any comments or questions, please feel free to leave them on the blog or email me at bobsadviceforstocks@lycos.com. If you get a chance, be sure and visit my Covestor Page where my trading portfolio is analyzed and reviewed, my SocialPicks page where all of my picks from the first of the year are also evaluated. If you are into podcasts, I have a good number of podcasts on varying stocks from the past two years kept on my Stock Picks Podcast page.
If you are interested in a new investment idea that may involve some additional risk, check out Prosper.com, a website that my nephew introduced me to, that involves some considerable risk with unsecured loans that are bid on eBay style in a sort of Dutch auction by multiple investors, most of whom are putting up $50 to be part of the lending consortium. While considerable risks are present, it is possible to widely spread out your loans and the returns are impressive unless individual borrowers default. So do your homework if you decide to pursue that website.
Until the end of the year, if you sign up you can receive $25 as a bonus and I also receive credit for referring you to the website! Definitely win-win.
Thanks again for visiting! Good-luck on Friday!
Bob
Wednesday, 24 October 2007
Snap-On (SNA)
Hello Friends! Thanks so much for stopping by and visiting my blog, Stock Picks Bob's Advice! As always, please remember that I am an amateur investor, so please remember to consult with your professional investment advisers prior to making any investment decisions based on information on this website.
 I wanted to try to be brief this evening as I actually have some plans to attend to! I wanted to review Snap-on (SNA), a stock that I do not own any shares or options, but a stock that I do believe belongs on the blog.
SNAP-ON (SNA) IS RATED A BUY
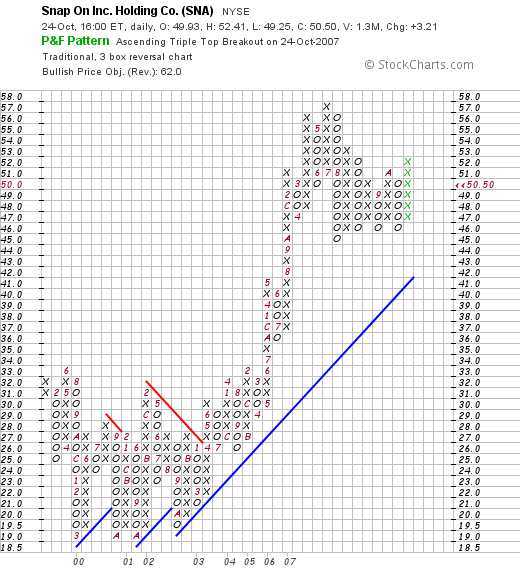
First of all, Snap-On made the list of top % gainers on the NYSE today, closing at $50.50, up $3.21 or 6.79% on the day. The stock rose today after the company announced strong 3rd quarter 2007 results, with increasing revenue and earnings. The company beat expectations of analysts both on earnings and revenue results.

Longer-term, the company has virtually a perfect
Morningstar.com "5-Yr Restated" financials page, with steady revenue growth, increasing earnings, increasing dividend, stable outstanding shares, growing free cash flow and a solid balance sheet.
Finally, the 'point & figure' chart from StockCharts.com looks strong with a steady recent price appreciation.
Valuation-wise, per the
"key statistics" from Yahoo, the company has a trailing p/e of 20, a PEG of 1.43, and minimal shares out short.
This is the kind of stock that deserves a spot on my blog, if not a place in my portfolio in the future!
Thanks so much for dropping by! I hope you don't mind this brief entry; I may well move towards briefer posts and let you do some of the grunt work with the links :).
If you get a chance, drop by and visit my Covestor Page, my SocialPicks page, and if you are interested, take a look at Prosper.com, the person-to-person lending website that I have started getting involved with. Be sure to be aware of all the risks involved in participating in unsecured loans that can also default, but you have to admit that this website is pretty amazing and a preview of what the Internet can offer all of us in the future!
Bob
Newer | Latest | Older


