Stock Picks Bob's Advice
Thursday, 12 October 2006
Regal-Beloit (RBC)
Hello Friends! Thanks so much for stopping by and visiting my blog, Stock Picks Bob's Advice! As always, please remember that I am an amateur investor, so please remember to consult with your professional investment advisors prior to making any investment decisions based on information on this website.
In case someone hasn't noticed, this blog is NOT about "getting rich quick". It isn't about any kind of gimmicks or short-cuts. What I am trying to do is simply to help you think about investments. To learn to 'look under the hood' so to speak. To ask questions. To check earnings reports, same-store sales, free cash flow, PEG ratios and Price/Sales ratios. In other words, to do your homework. It is my strong belief that if I can find a group of stocks with what I call quality characteristics that I will stand half a chance to have a portfolio that will perform respectfully relative to the market and other standards. We shall all have losing stocks and gaining stocks. But I want to know why any particular stock is in my portfolio at all. I hope that my evaluations help you address this same question!
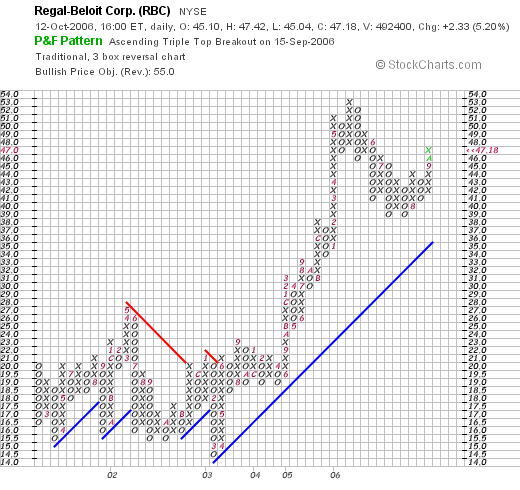
 This afternoon, after a great day in the market, I was convinced that I would be able to find another stock to discuss on this blog. As I do when I am looking for new stocks, I scan through the lists of top % gainers. In this particular case I was reviewing the list of top % gainers on the NYSE when I came across Regal-Beloit (RBC) which closed at $47.18, up $2.33 or 5.20% on the day. Why did I pick this stock when there are so many other stocks I could have chosen? In fact, I did look at a number of other stocks but nothing seemed to work as well for me as this company. Let me explain.
 In the first place, I do not own any shares of this company nor do I have any options. I am proud of the fact that this is another great Wisconsin company. O.K., so I am loyal to my state. But there are several of these midwestern firms that I like, including Manitowoc Co., Oshkosh Truck, and Johnson Controls. Let's add Regal-Beloit to this list as well.
What exactly does this firm do?
According to the Yahoo "Profile" on RBC, the company
"...engages in the manufacture and supply of electrical and mechanical motion control products principally in North America, Europe, and Asia. It operates in two segments, Electrical and Mechanical. The Electrical segment offers various products, including a line of alternate and direct current commercial and industrial electric motors; heating, ventilation, and air conditioning motors; and electric generators and controls, capacitors, and electrical connecting devices."
Is there anything in the news to explain today's move?
No. I don't see anything particularly pertinent to move this stock today. I think that this stock probably moved together with all of the other stocks in the market. In addition, the company is a part of the S&P 600 SmallCap Index and the S&P 1500 Super Comp Indices, so perhaps in any institutions were buying the index, well this stock got bought up as well. That is about my best guess.
How did they do in the latest reported quarter?
On July 27, 2006, Regal-Beloit reported 2nd quarter 2006 results. For the quarter ended July 1, 2006, net sales increased 18% to $435.3 million from $368.8 million in the second quarter of 2005. Net income grew an impressive 80.6% to $33.3 million, up from 418.4 million in the same period in 2005. Diluted earnings per share climbed 59.7% to $.99/share, up from $.62/share in the same quarter in 2005. Clearly, this was a fantastic report.
If you are a regular reader of this blog, you will know that one of the key determinants of an earnings report, in regards to its effect on the 'market' is what the company did relative to the expectations of analysts who follow this stock. As reported, analysts polled by Thomson Financial had been expecting earnings of $.95/share on revenue of $436 million. So the company beat the expectations on earnings and came in a hair shy of the revenue figures expected.
The second part of an earnings report is the question of guidance. This again is an expectations game. In other words, the company is helping analysts out with how the future is going to turn out. When a company raises guidance it acts to raise expectations for earnings which acts to increase the price that investors or institutions are willing to pay for a stocks. This is probably related to a 'recalculation' of what is called the net present value of an investment. While not an exact analogy, the rethinking of future earnings streams to investors and stockholders results in a recalculation of the current price that a company is worth.
In this particular case, RBC did raise guidance in this report, forecasting third-quarter earnings in the range of $.78 to $.84/share. Analysts apparently had been expecting Regal-Beloit to earn $.67/share in the next quarter.
What about longer-term financial results?
Part of my evaluation of a stock is the review of results over the past several years. I am not seeking a quick turn-around or value investment. I am searching for what I call 'high-quality' companies. I define quality as a consistency in results, allowing a possible extrapolation of trends into the future with some reliability.
Reviewing the Morningstar.com "5-Yr Restated" financials on RBC, we find that revenue actually dropped from $664 million in 2001 to $605 million in 2002. However, since 2002, the company has grown steadily and has even seemingly accelerated that growth. Regal-Beloit reported $757 million in revenue in 2004, $1.43 billion in 2005 and $1.56 billion in the trailing twelve months (TTM).
Earnings have also been a bit erratic, increasing from $.93/share in 2001 to $1.01 in 2002, flat at $1.00 in 2003, then increasing strongly to $1.22 in 2004, $2.25 in 2005 and $2.93 in the TTM.
The company does pay a dividend: $.48/share in 2001 to 2004, then increased to $.51/share in 2005 and $.53/share in the TTM.
On a negative note, the company has been increasing its float with 21 million shares reported in 2001, increasing to 30 million by 2005 and 31 million in the trailing twelve months. Basically the company's shares are up 50% while earnings have been able to more than double and revenue has also climbed more than 100%. So while I prefer to see minimal increase in shares, as long as earnings and revenue grow quicker, then it doesn't appear to be very significant to me.
Free cash flow has also been positive and strong with $41 million in 2003, $22 million in 2004, increasing to $84 million in 2005 and the TTM.
Looking at the balance sheet from Morningstar.com, we find what appears to be a solid report with $24.6 million in cash and $532.8 million in other current assets. This total of $557.4 million, when compared with the $274 million in current liabilities yields a current ratio of 2.03. In general, current ratios over 2.0 are considered 'healthy'. In addition, RBC has $441.6 million in long-term liabilities.
How about some valuation numbers for this stock?
Examining the numbers on Yahoo "Key Statistics" for Regal-Beloit, we find that this is a mid-cap stock with a market capitalization of only $1.46 billion. The trailing p/e is a reasonable 16, with a forward p/e (fye 31-Dec-07) estimated at 13.37. The PEG is reported at 1.17 (5 yr expected).
Checking the Fidelity.com eresearch website for some additional comparative figures, we find that RBC is in the "Industrial Electrical Equipment" industrial group. The company is a good value insofar as the Price/Sales ratio is concerned. The most expensive in the group is Rockwell Automation (ROK) with a ratio of 2, followed by GE at 1.1, Eaton (ETN) at 0.5 and the most reasonable in the group are Regal-Beloit (RBC)O at 0.4 and Energizer Holdings (ENR) at 0.4.
Checking on profitability, as measured by ROE (Return on Equity), we find that unfortunately RBC is at the bottom by this measurement. Leading this group is Energizer at 74.5%, Rockwell at 34.9%, Eaton at 22.1%, GE at 17.6% and RBC at 14.5%.
Going back to Yahoo, the company has 30.87 million shares outstanding, with 28.35 million that float. As of 9/12/06, there were 1.97 million shares out short representing a significant 9.2 trading days of volume (or 6.60% of the float). Any time the short ratio climbs over 3 days, I believe this is a significant factor that can lend support to a stock price in light of good news. We may well have been seeing a bit of a squeeze of the shorts as the entire market moved higher.
As noted, the company pays an anticipated dividend of $.56/share yielding 1.3%. The company last split its stock, per Yaho, on August 15, 1994 when the stock split 2:1.
What does the chart look like?
If we review the "Point & Figure" chart on Regal-Beloit from StockCharts.com, we can see that the stock really went nowhere between 2001 and into June, 2003. Sometime in June, 2005, the stock broke out above $21 and has been moving higher since. The chart looks strong to me and not over-extended.
Summary: What do I think about this stock?
Let's review a few points on this stock. No particular news that I can see resulted in a nice move higher today. Perhaps the relatively large number of short-sellers got squeezed. I don't know for sure. The latest quarter was phenomenal with the company essentially beating expectations for earnings and raising guidance.
The last several years have been excellent for RBC, with revenue growing extremely strongly, earnings increasing solidly, and the company even pays a dividend which has been increased the past couple of years. The company has been increasing its float a tad quicker than I would prefer to observe. Free cash flow is positive and growing and the balance sheet appears solid with a current ratio over 2.
Valuation-wise, the p/e appears reasonable in the mid-teens, the forward p/e is even lower and the PEG is just a tad over 1.1. The Price/Sales is cheap, but the ROE is the weakest in its group. One thing that may be supporting this stock is the strong short interest with over 9 days of short interest outstanding. Finally, the chart looks solid. There really isn't much I don't like about this stock come to think. But then again, I don't have a buy signal, so I am still sitting on my hands even if the overall market is starting to move higher. But if I were buying....well this is the kind of stock I might be adding to my portfolio!
Thanks once again for taking the time to visit! If you have any comments or questions, please feel free to leave them on the blog or email me at bobsadviceforstocks@lycos.com.
Bob
Wednesday, 11 October 2006
A Reader Writes "....I was wondering if you could help me...?"
Hello Friends! Thanks so much for stopping by and visiting my blog, Stock Picks Bob's Advice! As always please remember that I am an amateur investor, so please remember to consult with your professional investment advisors priot to making any investment decisions based on information on this website.
 As I do with each blog entry, I encourage you to drop me a line with your comments and questions at bobsadviceforstocks@lycos.com. And I mean it! I enjoy hearing from readers and try to answer and comment on as many of the emails as possible.
Earlier today, I saw that Eric P. had written me a note with a few comments and questions:
"Hey Bob!
Well, I am sort of new to your website, but I believe it has been a great resource to me to help research and learn stocks. Though recently I have been looking at this one Escala Group Inc. (ESCL), and I was wondering if you could help me try to figure out if this would be a good purchase or not. Also, I have been looking through your website, and I was wondering do you have an actually blog or article of how you research your stocks or how you filter through so many stocks? And do you have any tips to help me in my searches!
Thanks so much, and keep up the great work!
Eric"
First of all, thanks so much for writing. I cannot tell you whether ESCL would be a good purchase or not for you. I don't know your particular situation and I am not really qualified to do that. However, I can tell you a little about how the stock looks from my perspective.
I cannot go into my usual detail, but let's check it out. A couple of points, first of all Escala Group (ESCL) is a tiny company with a stock price significantly under $10. I try like crazy to avoid these stocks. With my tight 8% loss limit, a $5 stock can only drop $.40 before hitting a sale. And these little companies are quite volatile.
Furthermore, the company just a few days ago, on October 2, 2006, received notification from the NASDAQ that it risked delisting as it was late in filing its annual report for its year ended June 30, 2006. Apparently, Escala is investigating the Company's dealings with Afinsa Bienes Tangibles, S.A. "its majority shareholder". For me, this is much too much smoke occluding my view of the company's results. This is not a company that I would be interested in pursuing at this time on this blog.
It is true, on Escala's behalf, that the company does have a terrific Morningstar.com "5-Yr Restated" financials page. They do have a record of rapid growth recently both in terms of revenue, reported earnings, free cash flow, and a good balance sheet. Thus, if some of the questions on the results, delisting issues, are cleared up, this stock may well turn out to be a great investment! However, for me, that's a lot of ifs and buts. A bit too speculative for me both in terms of the share price, and the dark clouds overhanging the financial results.
Regarding your question of a blog on my strategy, I have done this on several occasions. Recently, I wrote up my strategy on November 21, 2005, I also had some additional comments on November 4, 2005. You also might enjoy my comments on June 17, 2005. Also check out comments on June 2, 2004. Also visit my Stock Picks Podcast Site and look through my topics to find my Investment Strategy Podcast.
In general, I write about my strategy throughout my many entries. Read a few and I think you will catch on!
How do I filter stocks? I hate to say it, but I do it manually. I literally do it like I say I do. I check the top % gainers list and look through it to see what stocks are over $10. Then I check Morningstar, the latest quarter, etc. Read my posts and I think it will be obvious.
Thanks so much for writing! Please let me know if I have answered your questions adequately. If not or if you or anyone else has questions or comments, please feel to enter them right here on the blog or email me at bobsadviceforstocks@lycos.com.
Bob
CVS Corp (CVS) "Revisiting a Stock Pick"
Hello Friends! Thanks so much for stopping by and visiting my blog, Stock Picks Bob's Advice! As always, please remember that I am an amateur investor, so please remember to consult with your professional investment advisors prior to making any investment decisions based on information on this website.
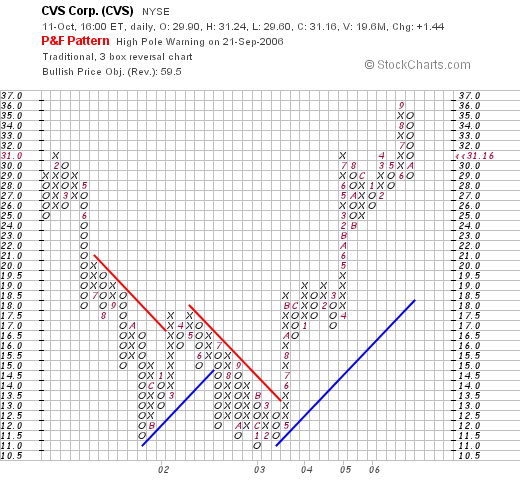
This afternoon, while scanning the list of top % gainers on the NYSE, I came across an old favorite of mine, CVS Corp (CVS), that was moving higher. CVS closed at $31.16, up $1.44 or 4.85% on the day. I do not own any shares of this stock nor any options, however, I did buy 22 shares of CVS today for my son in place of his Healthways stock (18 shares) that I also sold out of his account today.
 I say 'old favorite' and 'revisit' because CVS was first posted on Stock Picks Bob's Advice on October 7, 2003, almost exactly three years ago when it was trading at $33.57. CVS split 2:1 on June 7, 2005, making my stock pick price effectively $16.79, and with today's closing price of $31.16, this represents a gain of $14.37 or 85.6% since the stock was first posted.
Let's take another look at this stock and I shall share with you why I believe it still deserves a place on this blog!
1. What exactly does this company do?
According to the Yahoo "Profile" on CVS, the company
"...operates retail drugstores in the United States. The company, through its stores, offers prescription drugs; general merchandise, including over-the-counter drugs, beauty products and cosmetics, seasonal merchandise, greeting cards, and convenience foods; and film and photofinishing services. It sells its products through CVS/pharmacy retail stores and online through CVS.com. The company also provides pharmacy benefit management, mail order services, and specialty pharmacy services to managed care and other organizations."
2. Was there any news to explain today's stock price move?
Looking through the Yahoo "Headlines" on CVS for news stories, it was reported that the company yesterday raised guidance for the third quarter "...to between 31 cents and 33 cents per share compared with previous guidance of between 28 cents and 30 cents per share."
In addition, on October 10, 2006, the company reported same-store sales numbers that exceeded analysts' expectations. The company reported an 8.8% increase for stores open at least a year, for the five weeks ended September 30, 2006. Analysts were expecting an 8.4% increase. While pharmacy same-store sales which came in at a strong 9.8% were a tad short of the 9.9% analysts forecast, 'front-end' sales of other merchandise increased 6.5%, well ahead of the analysts who were expecting a 5.2% increase.
This combined strong same-store sales figures beating expectation, and the raising of earnings guidance combined to push the stock higher on an otherwise weak trading day.
3. How did they do in the latest reported quarter?
On August 3, 2006, CVS reported 2nd quarter 2006 results. For the quarter ended July 1, 2006, net revenue increased 15.8% to $10.6 billion, up from $9.1 billion during the second quarter of 2005. Same store sales for the quarter increased 8.8%, with pharmacy same store sales increasing 9.1% and front-end same store sales growing by 8.1%. Net earnings for the quarter increased 22.5% to $337.9 million or $.40/diluted share, up from $275.9 million or $.33/diluted share in the second quarter of 2005. These numbers exceeded analysts expectation for the quarter: analysts had expected revenue of $10.43 billion and earnings of $.37/share. The company beat both of these estimates!
4. How about longer-term financial results?
Examining the Morningstar.com "5-Yr Restated" financials on CVS, we can see a very pretty picture of steady revenue growth with $22.2 billion in revenue in 2001, growing to $37 billion in 2005 and $39.2 billion in the trailing twelve months (TTM).
Earnings during this same period have also steadily increased from $.50/share in 2001 to $1.45/share in 2005 and $1.56/share in the TTM.
The company has been paying dividends and slowly increasing the payout. $.12/share in 2001, increased to $.13/share in 2004, $.15/share in 2005 and the TTM.
The number of shares outstanding has modestly increased from 781 million in 2001 to 812 million in 2005 and 821 million in the TTM. This is less than 5% increase in shares while revenue grew 50% and earnings more than tripled. A reasonable price to pay for very strong earnings and revenue growth!
Free cash flow, which was negative at $(153) million in 2003, and $(434) million in 2004, turned positive at $117 million in 2005 and higher yet at $308 million in the TTM.
The balance sheet is adequate with $532.3 million in cash and $9,017.4 million in other current assets. Added together and compared with the $8,632.1 million yields a current ratio of 1.11. I personally prefer a current ratio closer to or higher than 2 to indicate a 'healthy' balance sheet. However, the rest of the numbers that CVS reports are rather compelling!
5. How about some valuation numbers on this stock?
Looking at the Yahoo "Key Statistics" on CVS, we can see that this company is a large cap stock with a market capitalization of $25.6 Billion. The trailing p/e is a very reasonable 19.95 (imho), with a forward p/e of 16.57 (as estimated for fye 31-Dec-07). With quick growth estimated, the stock appears to be an excellent value with a PEG (5 yr expected) estimated at 0.62.
Exploring the Fidelity.com eresearch website, we find that CVS is in the "Drug Stores" industrial group. Within this group, CVS is reasonably priced with a Price/Sales ratio of only 0.2. Topping this group is Omnicare (OCR) at 0.6 and Rite Aid (RAD) also at 0.6. Along with CVS is Walgreen (WAG) and Medco Health Solutions (MHS) also with Price/Sales ratios of 0.2.
Looking at the Return on Equity (ROE) figure, this group is led by Rite Aid at 246.3%, followed by Walgreen at 17.9%, CVS at 16%, Medco at 7.2% and Omnicare at 6%.
Finishing up with Yahoo, CVS has 821.42 million shares outstanding with 816.9 million that float. Of those that float, 13.57 million shares were out short (down from 16.48 million the prior month) on 9/12/06 representing 1.7% of the float or 3.4 trading days of volume. This is mildly significant (from my significance cut-off of 3 days of short interest).
As I noted earlier, the company pays a dividend estimated at $.16 or 0.5% in the forward 12 months. The company last split its stock with a 2:1 split on June 7, 2005.
6. What does the chart look like?
Reviewing the "Point & Figure" chart on CVS from StockCharts.com, we find that the chart appears to be a "V-shaped" graph! The stock spent much of 2001 into early 2003 declining from a high of $31 to a low of $11 in January, 2003. The stock broke out higher in May, 2003, at $13 and has moved strongly higher since to its current level of $31.16.
7. Summary: What do I think about this stock?
Let me try and summarize some of the things this review touched on. First of all the stock moved higher on very strong same-store sales reports of both the pharmacy as well as 'front-end' sales of non-pharmacy merchandise. This was ahead of analysts expectations. And the company went ahead and raised guidance for the upcoming quarter.
Looking at the latest quarterly report, the company grew its revenue and earnings strongly and beat expectations.
Longer-term, the company has been quite strong the past 4 years with steady revenue and earnings growth. Growing its dividend while very slowly increasing the shares outstanding. Free cash flow has turned positive and is growing nicely and the balance sheet is at least adequate.
Valuation-wise, the p/e is in the teens and the PEG is under 1.0. The Price/Sales ratio is at the lowest of its group and the return on equity is near the top of the same industrial group. Finally, there aren't too many shares out short, and the graph looks nice for at least the past three years without looking over-valued.
In summary, I like this stock. Enough to buy a few shares for my son in an account I monitor. And enough to write up this stock once again after an interval of three years! The stock still looks promising to me!
Thanks so much for stopping by and visiting! If you have any comments or questions, please feel free to drop me a line at bobsadviceforstocks@lycos.com. I cannot promise to answer all of my emails, but I shall certainly read all of them and include as many as possible in these entries. Also, be sure to visit my Stock Picks Podcast site where you can listen to me talk about many of the same stocks on the blog!
Bob
"Trading Transparency" Healthways (HWAY)
Hello Friends! Thanks so much for stopping by and visiting my blog, Stock Picks Bob's Advice! As always, please remember that I am an amateur investor, so please remember to consult with your professional investment advisors prior to making any investment decisions based on information on this website.
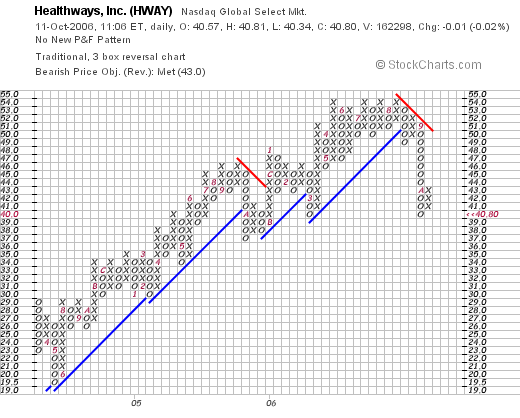
Earlier today I decided to "pull the plug" on my Healthways stock which appears to be having some fundamental, perhaps short-term, earnings questions. I sold my remaining 107 shares of HWAY at $40.64/share. These shares had been purchased 6/18/04, with a cost basis of $23.53/share, so I had a realized gain of $17.11 or 72.7% on these shares. I have actually sold portions of my original investment in HWAY four times previously, at 30, 60, 90 and 120% gain levels, so this has been a good investment for me.
Of concern was the news story released on October 3, 2006, just a week ago, where HWAY lowered 4th quarter and full-year outlook. They guided to $.36 to $.38/share for the upcoming quarter, below analysts' views of $.53 to $.56/share. Apparently some Medicare health support pilots, as the news states, generated 'less revenue than expected'.
If we examine the "Point & Figure" chart on Healthways, we can see how the stock really broke down in September, 2006.
In any case, with "bad news", I did not think it wise to let the stock pull back to my own trailing stop. Time will tell if this is the right decision, but overall, the stock has been good to me and the portfolio has appreciated along with this investment.
Thanks so much for stopping by and visiting! Please be sure to drop me a line at bobsadviceforstocks@lycos.com if you have any questions or comments.
Bob
Tuesday, 10 October 2006
A Reader Writes "I do have a few questions about your mechanics."
Hello Friends! Thanks so much for stopping by and visiting my blog, Stock Picks Bob's Advice! As always, please remember that I am an amateur investor, so please remember to consult with your professional investment advisors prior to making any investment decisions based on information on this website.
I was getting ready to get to sleep when checking my mail, I found a very nice letter from Keith H. who writes from Melbourne, Floriday. I decided if Keith was so kind to write, to include some of my thoughts in his presentations to his stock club, well I could do no less than respond to his questions as soon as I got them!
Keith wrote:
"Hey Bob
This is Keith H. from Melbourne, Fl again. Sorry I have not written in a while. I have been recommending your podcast and blog to my IBD group....I hope they are listening. I even used you in one of talks on Selling Strategies (I included the presentation). I really like your disipline and that is what I try to teach them.
I do have a few questions about your mechanics.
1. Do you always buy in the same dollar amounts?
2. Are you on a buy or sell signal right now? I know you have said you are not buying anything at the moment but is that because you are on a sell signal and none of your stocks have given a buy signal or you are fully invested (whatever that means to you).
3. Do you have to get a buy signal for each purchase? For example: let's say we are in a bear market and you are down to 6 stocks and have lots of cash. You finally get a buy signal and buy a stock. Are you still on a buy signal or did you just satisfy that buy signal with a purchase and now have to wait for another buy signal? Or are you on a buy signal until you get a sell signal?
4. Is it a buy signal or sell signal when a stock hits a profitable trailing stop?
5. Have you ever thought of using Leaps instead of buying the stock so you are not on margin?
6. Have you created a spreadsheet to manage your portfolio and your buy, sell and trailing stops points?
I have included an interesting spreadsheet for you that I created. Not sure it will make a lot of sense with me not walking you through it but the Yearly Returns tab shows the yearly returns of various investment strategies (this was to show them stick with a strategy and over time it will work). I also showed them risk adjusted returns. And on tab % Gain Dif, I tried to show them the importance of what an addition % or 2 would mean to your portfolio over time.
Keep up the good work. I listen to your podcast on my daily walks. I just wish iTunes would post you podcast in a more timely manner.
Keith"
First of all, I thank you for writing, reading, and listening to my podcasts! You have absolutely NOTHING to apologize about! If anything, I would like to thank you for your enthusiasm and sharing my ideas with your stock club. You will have to let me know if any of the stocks I have presented have made it into your club's portfolio and how they turned out. Not everything I write about turns out profitable!
Let me try to answer your questions in order:
1. I don't always buy in the same dollar amount. Recently I have been trying to do this...hopefully buying about $5,000 worth of stock on each new position. Unfortunately, I do abuse this account....using funds for miscellaneous household expenses and I make my car payments out of this stock fund. This is a real account for me....probably shouldn't be doing this when I am writing a blog though. However, my trading rules are rather strictly followed (except for a shot at Kendle which lost me some money!). Regardless of what I have been doing, I would suggest that people do make equal dollar purchases.
2. Am I on a buy or sell signal right now? The answer is no. I am at 11 positions I recently wrote about. Unfortunately, I am flirting with two sales of stocks....my Healthways (HWAY) is acting ill after reporting a shortfall on revenue expectations due to some Medicare contracts that apparently got delayed, and my ResMed (RMD) stock is flirting with a 30% gain level which would signal me to sell (I have sold twice at 30 and 60% levels...so this would be a 50% retracement). Looking through my other stocks, my Coach stock is near a sale at a gain....my last sale, if you can believe it (!) was at a 300% gain, I am at a 329% gain now, and would sell 1/6th of my 102 shares if it hits a 360% gain. (with a cost basis of $8.33 (!), that works out to 4.60 x $8.33 = $38.32. COH closed today at $35.79...so that isn't too far off.) The only other stock that is possibly close to a sale at a gain is my Wolverine World Wide (WWW) which has a 16.84% gain. I shall not be selling until it either hits a loss of 8%, or appreciates to a 30% gain, which, with my cost basis of $23.55, would be at 1.3 x $23.55 = $30.62. WWW closed at $27.51 today....so that might not be too far off (?). Insofar as being 'fully invested', as I have indicated, my full investment is 25 positions, so at 11 positions, I am far from fully invested.
3. Do I have to get a buy signal for each purchase? Yes. However, you do talk about 'my exception'. That is, if I am at a minimum number of positions in my portfolio, then I will get a buy signal if either one of my six stocks sells on the downside...as I need to replace it, or if one of the six stocks hits an appreciation target. The buy signal, as I employ it, only allows me to buy one stock. And that stock needs to be on the top % gainers THAT day. How is THAT for an arbitrary decision?
4. If a stock hits a profitable trailing stop, that means it has declined from an even higher level, and I still call that "bad news". I only get an appreciation buy signal when a stock breaks into new territory and I sell 1/6th of my holding. When a stock pulls back to that trailing appreciation target (1/2 of it highest appreciation target), then that is definitely "bad news" and once again I sit on my hands unless my portfolio is at a minimum number of positions.
5. LEAPS....perhaps. But it isn't something I do with this portfolio. I have had a miserable track record with options. But that doesn't mean somebody else could do the same thing with LEAPS that I do with stocks using some of the same criteria. It might even work. It just isn't what I do.
6. Spreadsheet? No, unfortunately. I literally scan through each of my holdings, and Fidelity has a wonderful online reporting system that shows all of my sales, cost basis, current % gain/loss etc. I end up practically counting on my fingers going 30, 60, 90, 120%, etc. do figure out if I am near a sale target. Probably could do this a whole heck of a lot better....but you know I really AM an amateur. I am serious about that. I just love stocks.
p.s. I took a look at your spreadsheet you created. I am absolutely flattered to be in you PowerPoint presentation. I hope that I am helpful and have earned that place. One thing I really could do is to use a disciplined spread sheet with my purchases/sales and be able to present a more accurate performance evaluation of my trading portfolio. That I shall save for the future!
Thanks again for visiting!
If any of you have questions or comments, please feel free to email me at bobsadviceforstocks@lycos.com.
Bob
Johnson Controls (JCI) "Revisiting a Stock Pick"
Hello Friends! Thanks so much for stopping by and visiting my blog, Stock Picks Bob's Advice! As always, please remember that I am an amateur investor, so please remember to consult with your professional investment advisors prior to making any investment decisions based on information on this website.
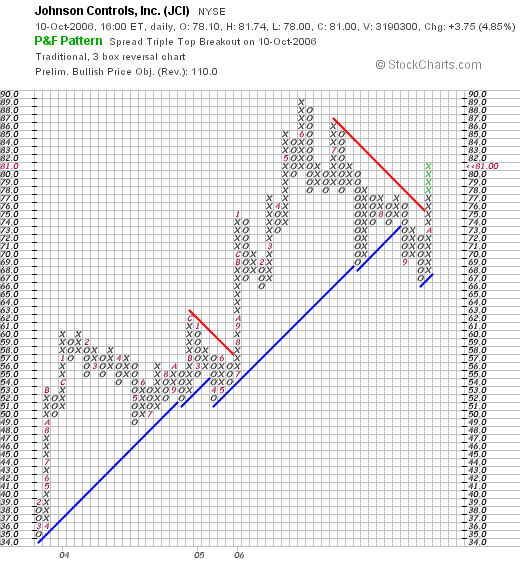
This blog is entering its fourth year (!) and I am starting to see some recurring names among the stocks making the lists. Johnson Controls made the list of top % gainers today, closing at $81.00, up $3.75 or 4.85% on the day. I do not own any shares of JCI, but a couple of my kids have a few shares (a lot less than even 100 shares total).
 I first posted Johnson Controls on Stock Picks Bob's Advice on July 9, 2004, when the stock was trading at $53.24. With today's close at $81, this represents a gain of $27.76 or 52.1% since the original post.
Almost exactly one year ago, on October 12, 2005, I "revisited" Johnson Controls (JCI) on Stock Picks when the stock was trading at $63.60. With today's close at $81.00, this still represents a gain of $17.40 or 27.4% since posting this stock a year ago on this blog.
Let's take another look at this company and see if it still deserves a spot on this blog!
1. What exactly does this company do?
Taking a look at the Yahoo "Profile" on Johnson Controls, we find that the company:
"... provides installed building control systems and technical and facility management services for the nonresidential buildings market worldwide. It operates through three segments: Building Efficiency, Interior Experience, and Power Solutions."
2. Was there any news today to explain the stock price move?
Scanning through the Yahoo "Headlines" on JCI, I found a report on an upgrade by Robert W. Baird from 'neutral' to 'outperform'. Also reported, was the story about Johnson Controls "Annual Analyst Meeting". Although the reports from the company sounds mixed to me--fourth quarter guidance was raised to $1.86 to $1.91/share, ahead of analysts' estimates of $1.84/share, but fiscal-year 2006 profit would come in at $5.10 to $5.15/share, slightly below analysts' expectations of $5.21/share. Also, first quarter 2007 results were guided to $.80 to $.85/share, below analyst predictions of $.95/share. However, fiscal 2007 was estimated at $6.00, ahead of the $5.99 expected.
Somehow, although I did NOT attend this meeting, it appears that the stock price has been held back due to the large portion of its business tied to the slowing American auto industry. However, the company is apparently doing better than expected in the battery business and building environmental control business. As Morgan Stanley analyst Jonathan Steinmetz, who reiterated his "overweight rating" stated:
"Today's analyst day showed that our thesis for upgrading the stock still holds but that at the margin, building efficiency and power solutions are doing better than we had originally anticipated, and the auto interior business is doing worse."
3. How did they do in the latest reported quarter?
On July 20, 2006, Johnson Controls announced 3rd quarter 2006 results. Sales for the 3 months ended June 30, 2006, came in at $8.4 billion, up 19% from the $7.1 billion reported in the same quarter the prior year. Net income came in at $338 milion, up from $255 million in the same quarter last year. Diluted earnings per share worked out to $1.70/share this year, up from $1.31/share the prior year. Insofar as expectations on this report, it was reported that analysts from Thomson First Call had been looking for earnings of $1.68 (the company beat this), on sales of $8.43 billion (the company came in a bit light from expectations.)
4. What about longer-term financial results?
The "5-Yr Restated" financials on Johnson Controls (JCI), as reported by Morningstar.com, is really a very pretty picture. imho. First of all, looking at the revenue, the ever-increasing row of purple bars demonstrates the vigorous revenue growth from $17.4 billion in 2001 to $27.5 billion in 2005 and $31 billion in the trailing twelve months (TTM). It is the consistency of results that defines quality for me! And Johnson Controls shows consistency!
Examining the earnings, we can see the same steady increase from $2.55/share in 2001 to $4.68/share in 2005 and $4.86/share in the TTM.
The company also pays a dividend which is a plus. And the big plus is the steady increase in the dividend from $.62/share in 2001 to $1.00/share in 2005 and $1.09/share in the TTM.
Free cash flow has been strong, if a bit variable, over the last several years with $205 million reported in 2003, increasing to $520 million in 2004, dropping to $263 million in 2005 and back to $572 million in the TTM.
Of all of the data, the balance sheet is the least impressive on this page, imho. Not because the company is insolvent, but simply because the combined cash and other current assets adds up to $9.34 billion, which when compared to the $8.68 billion in current liabilities, gives us a current ratio for Johnson Controls of only 1.08. It has not been uncommon on this blog to see companies with ratios at 2 or higher, a common value for a "healthy" balance sheet. But with the solid free cash flow, and growing revenue and earnings, I am not very concerned about the financial health of the company. However, I cannot gloss over these things that I fine, even if they are counter to my over-all impression of the stock!
5. What about some valuation numbers on this stock?
Taking a look at Yahoo "Key Statistics" on JCI, we find that this company is a large cap stock with a market capitalization of $15.84 billion. The trailing p/e is a very reasonable (imho) 16.68, with a forward p/e (fye 30-Sep-07) estimated at 13.52. Thus, the PEG suggest a reasonable valuation with a value of 1.12.
Evaluating the valuation from the Price/Sales perspective, and using the Fidelity.com eresearch website, we find that in the industrial group of "Auto Parts", Johnson Controls is very reasonably valued with a Price/Sales ratio of 0.1. Topping this group is BorgWarner (BWA) at 0.3, Magna International (MGA) at 0.3, American Axle (AXL) at 0.2, and both Johnson Controls and Lear (LEA) tied at the bottom of the group with a ratio of 0.1.
Checking profitability, from the perspective of the Return on Equity ratio (ROE), we find that Johnson Controls leads the group, tied with BorgWarner at 15%, followedby Magna Intl at 9.6%, American Axle at 5.3% and Lear with a negative (103.8)% ROE.
Thus, while the price/sales ratio is excellent for valuation, the profitability also leads its particular group of stocks.
Finishing up with Yahoo, we find that the company has 195.57 million shares outstanding with 194.63 million that float. Of these, 2.24 million (down from 2.68 million the prior month) as of 9/12/06 were out short representing just 1.20% of the float or 2.3 trading days of volume (under my cut-off of significance of 3 days for the 'short ratio').
As noted, the company does pay a dividend with an anticipated payment of $1.12 yielding 1.50%. The company last split its stock with a 2:1 stock split on January 5, 2004.
6. What does the chart look like?
Taking a look at the "Point & Figure" Chart on JCI from StockCharts.com, we can see that the stock has made an extremely strong move from March, 2003, when the stock bottomed out at $35, until it hits its recent high at $89 in June, 2006. The stock has pulled back from that high after the last quarter was a bit of a mixed-bag, hitting a low of $67 in September, 2006. Recently, the stock has been quite strong, with analysts' upgrades and the like, breaking through resistance at $75 to its current level at $81. If I had my druthers, I would like to see this stock stay above $76 on its testing to the downside and once again move higher. Overall the graph is encouraging to me without being over-extended.
7. Summary: What do I think about this stock?
Let's review some of the things I discussed on this entry and compare the plusses and minuses on this company. First of all, this stock has been a tremendous performer for me on this blog....demonstrating the power of consistent revenue and earnings growth on price performance imho. The company moved higher after an analysts' meeting with the company. I believed that JCI convinced analysts that even though the auto market remains soft, that this company has enough other businesses to continue with dynamic growth...even IF the next quarter IS going to be a tad weak. The last quarter's result was strong although expectations were not completely exceeded. And the Morningstar.com report is beautiful with steady revenue growth, earnings growth, dividend growth, and free cash flow. The balance sheet is a bit average...with a current ratio just a little over 1.0. Would like to see the company with a bit more cash.
Insofar as valuation, the p/e is reasonable, the PEG is just over 1.1, the Price/Sales is the lowest in its group, and the Return on Equity is the highest. These are all great numbers.
There aren't many shares out short, the company pays a small dividend and has split its stock almost three years ago.
All-in-all I do like this stock. I especially like that strong and stead revenue, earnings, and dividend growth. I also appreciate the potential of the auto battery business as the company is a key player in the hybrid battery business. In a morbid note, with all of the school security problems recently, the company may well be a big player in security upgrades in classrooms across the country. My analysis does not depend on this unfortunate development.
Thanks again for stopping by and visiting! Each one of you who stops by and visits is welcome to stay and browse. I hope that my writing is helpful to you. If you have any comments or questions, I very much look forward to all of your emails. You can reach me at bobsadviceforstocks@lycos.com. I shall try to answer as many as I can and shall include the interesting ones in my blog. Also be sure and visit my Stock Picks Podcast where I discuss many of the same stocks I write about right here!
Bob
Monday, 9 October 2006
A Reader Writes "...when do you decide to sell the rest?"
Hello Friends! Thanks so much for stopping by and visiting my blog, Stock Picks Bob's Advice! As always please remember that I am an amateur investor, so please remember to consult with your professional investment advisors prior to making any investment decisions based on information on this website.
Checking my mail this evening I saw that I had a nice note from Steen S. who had some questions about my selling strategy. If you have any questions or comments, please feel free to drop me a line at bobsadviceforstocks@lycos.com and I will try my best to respond, possibly right in the blog!
Steen wrote:
"Hey,
I am a fairly new reader of your blog and listner to your podcast.
I find the idea behind your system very good (about cashing in at certain % gain), but when do you decide to sell the rest of you holdings? Are you holding on to even very small number of stocks and sticking to the system or do you sell the rest at a certain time (exept from your loss sell signals).
Steen
Steen, thanks so much for writing! I shall try to go over my selling strategy which I have described on many different entries in my blog and on some of my podcasts.
I do believe that picking stocks is only one part of the formula to successful investing. The other parts include knowing when to buy and when to sell and how much.
A couple of thoughts. First of all credit goes to the CANSLIM technique of William O'Neil who wrote the great book How to Make Money in Stocks, which if you haven't read, is definitely worth your time. O'Neil stressed the importance of limiting your losses. He recommended, and I have adopted the strategy of selling stocks at an 8% loss after a first purchase. This has certainly helped me limit my losses.
After this, I was faced with the problem of knowing when to sell if stocks did well. This is often much harder than selling when things are bad. It is tough to sell when you feel good about a stock. I have solved this challenge by setting up targeted appreciation points. At these points I sell a portion of my remaining holdings. Initially I chose 1/4 of my remaining position, figuring if a stock had appreciated by 1/3, I would have 4/3 of a stock and if I sold 1/3, well I still would be "whole."
However, after several rounds of sales I found that my remaining position was dwindling in size. And I just really wanted to sell some of my gains, not my original investment. Working with fractions of remaining positions, I chose and now follow the strategy of selling only 1/6th of my shares at my targeted appreciation points.
The general strategy is to sell my losing stocks quickly and completely and sell my gaining stocks slowly and partially.
My next challenge was to determine the appropriate sale points. I chose to start selling at 30% and by 30% intervals x 4: 30, 60, 90 and 120% appreciation targets. At each of these points I attempt to sell 1/6th of my remaining shares. After each group of four sales, I have been increasing the intervals for appreciation. I do this because after a 120% appreciation in the stock price, the stock has more than doubled, and for a similar appreciation in price, a 60% interval would be appropriate. Thus, my next four targeted appreciation points are at 180, 240, 300, and 360%. I have chosen to add 30% to the intervals after I have sold portions four times. That is after 360%, I add 90% x 4: 450, 540, and 630%....etc.
If a stock appreciates and doesn't announce anything fundamentally 'bad', it is possible that I never sell all of my remaining shares. At least not for a long time.
I do reserve the right to sell all of my shares at any time if something fundamentally negative is announced.
However, my system does allow me to sell all of my shares after I have sold portions of my stock holding on appreciation.
Again, reflecting thinking from William O'Neil who suggested one should never let a gain turn into a loss, I move up my sale point to 'break-even' after I have sold a portion one time at a 30% appreciation target. After this first sale, I plan on selling each position if they retrace 50% of the greatest appreciation target.
When I sell on 'bad news' whether it be on a retracement to break-even after hitting my first sale point at a 30% gain, I sell ALL of my remaining shares. For instance, if I have sold a stock three times at 30%, 60%, and 90% appreciation targets and then the stock starts trading poorly, my targeted sale on the downside would be at 50% of my highest sale point or in this case at a 1/2 x 90% or 45% appreciation level. Again these sales on the downside are for ALL remaining shares.
I hope that this answers your questions!
Let me just touch on the concept of "signals" or "permission slips" as I like to call it.
Again, I would like to express my appreciation to William O'Neil, who when talking about CANSLIM talked about determining the "M" in the "Market" in determining the timing to buy stocks. One thing he pointed out was that if one paid attention to one's own portfolio, one could learn quite a bit. In particular, he was discussing the fact that if a lot of your stocks are hitting sales at 8% losses, maybe your portfolio was "talking to you" more or less and saying that the market was not optimal for investment.
I use sales of stocks on 'bad news' as a reason NOT to reinvest funds, and sales of stocks on 'good news' as a reason to ADD a position.
First of all, I confess to having erred many times in buying a stock, sellling it in a 'disciplined fashion' when it hit an 8% loss and then buying another stock in quick succession only to lose another 8% loss quickly. I am sure many other investors have also made this same mistake! I realized that I was "compounding" my losses making things really worse in an awful market environment.
How could I avoid this? How could I learn to "listen" to my portfolio as O'Neil suggested? It was clear to me that if I had sold shares of a stock on 'bad news', meaning selling either at a loss or on a retracement to a sale-point, or even on 'bad news', then I should really AVOID compounding my losses. Or as I like to put it, I should leave the cash uninvested, instead just "sit on my hands"!
Well then, if I had just decided that selling on 'bad news' was a "signal" to "sit on my hands" then my portfolio really needed a mechanism to tell me to "buy a new position".
Some of this thinking, this search for a semi-mechanized approach to investing was likely influenced by another innovator, Robert Lichello, who had written, and I had read, the important book, How to Make $1,000,000 in the Stock Market - Automatically!. This is another great book to read if you ever get a chance.
Lichello, who developed the AIM system or Automatic Investment Management approach to investing, believed that the action of his portfolio could determine his response as he was regularly shifting between mutual fund shares and a money market fund.
My approach is NOTHING like Lichello's. But I do believe in allowing my portfolio help me understand what I should do in the market.
This search for a signal to buy, led me to the next step of using sales of my own positions on "good news" as a signal or 'permission slip' to add a new position.
However, it seemed obvious that I would need to always have some exposure to equities, thus, I would need a 'minimum' number of holdings in my portfolio. I needed to own shares because these positions were themselves the indicators of market sentiment. Trying to think logically, I chose to have a maximum number of positions at 25. (Currently I am at 11). Thus my "neutral" or starting position would be at 50% invested with 12 positions. My "conservative" posiiton, would be half of that or 6 positions and my maximum as noted 25.
Thus, if I am at my minimum number of positions (6) and I hit a sale point on bad news, then instead of 'sitting on my hands' I will go ahead and sell the stock and replace it with an appropriate new purchase as if I had a 'buy signal'. In the same vein, if I sell a portion of one of my 25 positions at a targeted appreciation point, instead of adding a new position, I shall be adding to my cash (or paying down my margin), leaving my total at 25.
When starting out, I recommend starting at 50% cash and 50% equities. If one wanted to have a maximum of 20 positions, then I would start at 10, and let market forces dictate to me whether I should be adding to or selling those positions. I would drop down to a minimum of 5 and a maximum of 20. This would more or less shift me in and out of the market based on market forces themselves.
I hope this answers your question! Once again, thanks so much for writing! If you have any other questions or comments, please feel free to write me at bobsadviceforstocks@lycos.com and I shall answer the best that I am able. If you find the time, please be sure and stop by and visit my Stock Picks Podcast Site.
Bob
Sunday, 8 October 2006
My Trading Portfolio Update: From Jubak's Refugees Site
Hello Friends! Thanks so much for stopping by and visiting my blog, Stock Picks Bob's Advice! As always, please remember that I am an amateur investor, so please remember to consult with your professional investment advisors prior to making any investment decisions based on information on this website.
Along the way I have been a contributor to the Jubak's Refugees on MSN. This is named after the famous stock picks Jim Jubak although he doesn't participate on that website as far as I can tell. Anyhow, from time to time, I have been sharing the results of my trades. Thus, what follows is what I wrote for the MSN site, which applies here as well:
It has been three months since I last posted. I have withdrawn money from my account for various sundry purposes, and probably shall be doing this once again with a new roof scheduled for my house this week. However, except for one "trade" in Kendle, I am sticking to my system.
This analysis is as of the close of trading on October 6, 2006.
I am now down to 11 positions (down from 14 positions three months ago). My maximum # of positions remains at 25, my minimum is still at 6.
The account net worth is $42,888.42. I am currently at 75.97% margin equity with a margin debt of $13,559.38. The market value of my securities stands at $56,447.80.
Current Positions (# shares, date of purchase, closing stock price, cost basis, % gain (loss))
Coach (COH) (102 shares, 2/25/03, $35.35, $8.33, 324.30%)
Cytyc (CYTC) (225 shares, 1/29/04, $23.53, $14.86, 58.39%)
Healthways (HWAY) (107 shares, 6/18/04, $42.76, $23.53, 81.75%)
Kyphon (KYPH) (150 shares, 5/20/06, $35.75, $29.21, 22.37%)
Morningstar (MORN) (167 shares, 11/22/05, $39.95, $32.57, 22.64%)
Quality Systems (QSII) (88 shares, 7/28/03, $40.69, $7.75, 425.11%)
ResMed (RMD) (150 shares, 2/4/05, $40.24, $29.87, 34.72%)
Starbucks (SBUX) (50 shares, 1/24/03, $38.41, $11.40, 236.79%)
Meridian Bioscience (VIVO) (210 shares, 4/21/05, $23.56, $11.13, 111.75%)
Ventana Medical Systems (VMSI) (188 shares, 4/16/04, $41.54, $23.47, 76.99%)
Wolverine World Wide (WWW) (240 shares, 4/19/06, $27.68, $23.55, 17.56%)
Since the last update on June 30, 2006, the following trades have been done: I sold 200 shares of Genesco (GCO) at $31.59 on 7/12/06, I sold 120 shares of Toro (TTC) at $44.06 on 7/13/06, and sold 360 shares of Barnes (B) on 7/17/06. On 7/27/06, I bought 800 shares of Kendle (for a trade) KNDL at $28.48, but sold it on 8/1/06 at $25.41.
As of 10/7/06, the account had $294.45 of taxable income and $2,642.47 of margin interest paid. The account had a net gain of $3,134.98, made up of a net short term loss of $(5,237.30) and a net long-term gain of $8,372.28.
As of the close of trading on 10/6/06, the company maintained its unrealized gain of $21,783.23.
I hope this continued reporting is helpful to you! The overall decline in value is both from the decline in stock prices as well as my pulling funds out for personal use. The figures to keep your eye on are the unrealized gains and the realized gains to get a better handle on how the account is doing.
If you would like more information, come and visit my blog at or email me at bobsadviceforstocks@lycos.com.
Bob
Thanks so much for stopping by and visiting! If you have any comments or questions, please feel free to leave them on the blog or email me at bobsadviceforstocks@lycos.com. Also, be sure to stop by and visit my Stock Picks Podcast Site!
Bob
"Weekend Trading Portfolio Review" Meridian Bioscience (VIVO)

Hello Friends! Thanks so much for stopping by and visiting my blog, Stock Picks Bob's Advice! As always please remember that I am an amateur investor, so please remember to consult with your professional investment advisors prior to making any investment decisions based on information on this website.
Besides reviewing stock picks on this blog, and discussing some general portfolio management techniques that I employ, I also like to share with you my actual trading portfolio. These are stocks that I currently own and with which I really do employ these stock picking and buying and selling strategies. My goal is to review one position (of my current 11 positions) every two weeks. Normally, with a full portfolio of 25 positions, this would be about once/year. However, with only 11 holdings, I shall continue this process and currently at this rate will be reviewing these stocks about once every 6 months.
Two weeks ago I reviewed my Starbucks holding on this blog. Going alphabetically (through the stock symbols), I am now up to Meridian Bioscience (VIVO). Let's take another look at my own trading history with this investment and see if it still deserves a place on this blog!

Currently, I own 210 shares of Meridian Bioscienc (VIVO) in my Trading Account. These shares were purchased April 21, 2005, with a cost basis of $11.13/share. I should note that this was not the first time I have owned Meridian in this account. Back on April 22, 2004, I purchased 400 shares of Meridian but only managed to hang on to these shares for a bit under a month before incurring a more than 8% loss, and selling the entire lot of shares on May 17, 2004. When the stock came up on the screens a year later, I went ahead and purchased my current holding.
Meridian closed October 6, 2006, at $23.56, down $(.47) or (1.98)% on the day. Thus, I have a current unrealized gain of $12.43 or 111.7% on these shares. As my trading strategy dictates, I have been selling portions of my holdings of Meridian at targeted appreciation levels. I have sold shares 7/25/05, 9/1/05, 10/3/05, and 1/6/06 at the 30, 60, 90, and 120% appreciation targets. Thus, my next targeted sale on the upside would be at a 180% gain or as calculated: 2.80 x $11.13 = $31.16. On the downside, with my last sale at a 120% appreciation target, allowing for a 50% retracement to a 60% appreciation level, would give me a sale target of 1.6 x $11.13 = $17.81. If the stock should drop to this level, I would be selling all of my shares, as opposed to my 1/6th remaining shares sale at positive appreciation targets.
But let's take a closer look at the stock itself and see how things 'stack up'!
1. What exactly does this company do?
Looking at the Yahoo "Profile" on VIVO, we find that the company
"...operates as an integrated research, development, manufacturing, marketing, and sales organization in the field of life science. It develops, manufactures, and distributes diagnostic test kits primarily for respiratory, gastrointestinal, viral, and parasitic infectious diseases; and bulk antigens, antibodies, and reagents used by researchers and other diagnostic manufacturers, as well as provides contract manufacturing service of proteins and other biologicals for use by biopharmaceutical and biotechnology companies that are engaged in research for new drugs and vaccines."
2. Is there any recent news that may be affecting the stock price?
Looking through the Headlines section on Yahoo, the only relatively recent news that I think is significant was the story on September 14, 2006, that MRO Software (MRO), which apparently was being acquired by IBM Corp., will be replaced in the Standard & Poor's SmallCap 600 index by Meridian (VIVO). For the S&P index, their SmallCap range is between $300 million and $2 billion. Since there are many investors and institutions that choose to make investments in vehicles that mirror these indices, this is a bullish news story for the company.
3. How did the company do in the most recent quarter?
On July 20, 2006, Meridian reported 3rd quarter 2006 results. Net sales for the quarter came in at $26.6 million, up 5% from $25.4 million in the same quarter the prior year. Net earnings were $4.86 million, up 39% from $3.50 million the prior year. Earnings per diluted share worked out to $.18/share, a 29% increase over the $.14/share reported the same quarter last year. In addition, in the announcement, they declared a regular quarterly dividend of $.115/share, with a $.46/share indicated annual rate, 44% higher than the regular quarterly rate of 2005. And also 'reaffirmed its recently increased guidance of net sales beteween $106 and $109 million (previously $103 to $107 million) and per share-diluted earnings between $.63 and $.66 (previously $.60 to $.63) for the fiscal year ending September 30, 2006.'
As good as this report sounds, the 'street' was a bit disappointed with the revenue report. As reported, the company did meet or exceed earnings results anticipated by analysts, they fell short of revenue estimates of $27.9 million and $26.8 million. Otherwise, the report was reasonably good especially with the continuing 'double-digit sales and earnings growth for fiscal 2007.'
4. What about longer-term financial results?
Reviewing the Morningstar.com "5-Yr Restated" financials on VIVO, we can see that the revenue growth has been very steady, increasing from $57 million in 2001 to $93 million in 2005 and $105 million in the Trailing Twelve Months (TTM).
Earnings, which were at a loss of $(.47)/share in 2001, turned profitable at $.23/share in 2002, and have increased steadily since to $.52/share in 2005 and $.66/share in the TTM. The company has been a steady dividend payer and has been raising its dividend each year (another plus for many investors.) The company paid $.17/share in 2001, $.31/share in 2005, and $.39/share in the TTM. There has been a small increase in the number of shares outstanding with 22 million reported in 2001 and 23 million in 2005 but 26 million reported in the TTM.
Free cash flow has been positive and growing. $11 million in 2003 increasing to $16 million in 2005 and $18 million in the trailing twelve months.
The balance sheet is gorgeous. The company is reported by Morningstar.com to have $35.7 million in cash, more than enough to pay off the current liabilities more than twice over and actually enough to pay off both the current and long-term liabilities which total togeter $22.7 million. The current ratio, when we add the $39.3 million of other current assets to the cash yields a ratio of 4.52. Generally, ratios of 2 or higher are considered 'healthy' at least from this particular perspective.
All-in-all, the Morningstar.com report is a very pretty picture of a small, steadily growing company.
5. What do the valuation numbers on this stock look like?
Looking at the Yahoo "Key Statistics" on VIVO we find that this company is a small mid-cap stock with a market capitalization of $615.52 million. The trailing p/e is moderately rich at 35.76, and the forward p/e is a bit better (fye 30-Sep-07) estimated at 28.05. No PEG is reported.
Examining the Fidelity.com eresearch website, we find that Meridian is in the "Diagnostic Substances" industrial group. Within this group, VIVO is reasonably priced with a Price/Sales ratio of 2.2. Topping the group is Human Genome Sciences (HGSI) with a ratio of 55.3, followed by ADEZA (ADZA) at 6.7, Myriad Genetics (MYGN) with a ratio of 4, then Meridian (VIVO) at 2.2, DIGENE (DIGE) at 1.5, and Dade Behring (DADE) at 0.9.
In terms of profitability, VIVO has the highest return on equity (ROE) of the group at 19.7%. This is followed by Dade Behring at 17%, ADEZA at 9.9%, DIGENE at 5.9%, Myriad Genetics at (17.1)%, and Human Genome Sciences at (63.3)%.
Finishing with Yahoo, we can see that there are only 26.12 million shares outstanding with 21.51 million that float. There are quite a few short-sellers on this stock with 1.24 million shares out short as of 9/12/06, representing 5.7% of the float or 8.9 trading days of volume. Using my own 3 day rule on the short ratio, this is triple that level, and if the company has any positive reports, there may well be a squeeze of the shorts pushing the shares higher. However, if the shorts are seeing something I don't....well that would mean they could be right! In any case, these 1.24 million shares that are already sold will need to be repurchased in the future and can only help prop up the stock price when that is done.
As noted, the company also pays a nice dividend with a forward annual rate of $.46/share yielding 2%. The company last split its stock with a 3:2 split on September 6, 2005.
6. What does the chart look like?
If we look at the Meridian Bioscience (VIVO) "Point & Figure" chart from StockCharts.com, we can see that this company has had a steady ride from $1.50 in February, 2001, when it last showed significant weakness, to its peak at $27 which it has hit three times in January, 2006, as well as in April, 2006. The stock has actually been trading sideways this year, but still appears to be above its support level. It does not appear over-extended to me, but I would like to see this stock, which is trading just under $24, to get through that $27 level to feel confident that it is on the upswing once again.
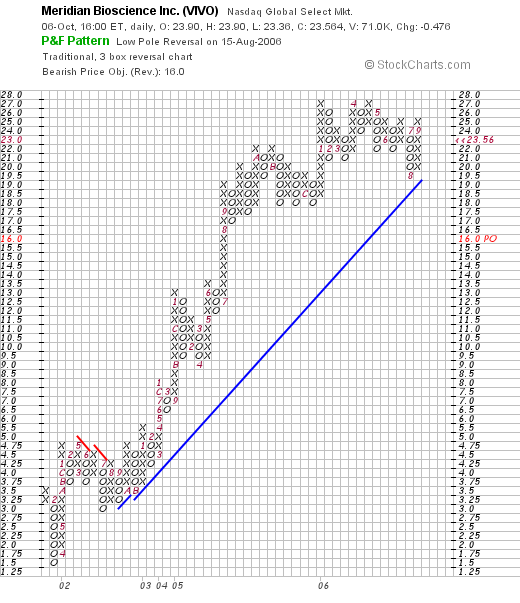
7. Summary: What do I think about this stock?
Let's take a look at a few things that I have commented on above. First of all, I own this stock so that is my own bias. However, the news of its inclusion in the SmallCap 600 is encouraging. The latest quarter was a tad soft on revenue growth with strong earnings and an increased dividend report. In addition, guidance appears to be reasonably bullish. I think the stock, if indeed we get a good next quarter, will resume its upward move. However, until then, we may have to wait while it 'treads water' so to speak.
The Morningstar report was very nice with a consistent growth in revenue, earnings and free cash flow. As "icing on the cake" the company pays a small dividend that it is regularly increasing. The balance sheet is solid. Valuation-wise, the p/e is a bit rich in the mid 30's. However, with the 30% plus earnings growth reported, even though we don't have a PEG, at least from this current quarter, I would expect that a PEG wouldn't be much above 1.5 if at all. But THAT is just my guess. Finally the chart looks nice. I think all it will take is another nice earnings report, and the stock price moves higher with the short-sellers scrambling to cover their bets that the stock price declines. Anyway, that's my view!
Thanks so much for stopping by and visiting! If you have any comments or questions, please feel free to leave them on the blog or email me at bobsadviceforstocks@lycos.com. When you get a chance, drop by and visit my Stock Picks Podcast Site where you can hear me talk about many of the same stocks I write about here on this website!
Bob
Saturday, 7 October 2006
"Looking Back One Year" A review of stock picks from the week of June 6, 2005

Hello Friends! Thanks so much for stopping by and visiting my blog, Stock Picks Bob's Advice. As always, please remember that I am an amateur investor, so please remember to consult with your professional investment advisors prior to making any investment decisions based on information on this website. I also always look forward to any of your comments, suggestions, or questions, and you can reach me at bobsadviceforstocks@lycos.com if you are so motivated!
One of my weekend tasks for the blog is to do a retrospective analysis of past stock selections. I have been doing this a week at a time, assuming that an equal dollar amount might have been purchased in each of the stocks discussed on the blog that particular week and that I employed a "buy and hold" strategy on these purchases. In reality, I suggest and employ a disciplined portfolio management system that involves selling losing stocks quickly and completely, and selling gaining stocks slowly and partially. For the sake of this review, I assume that stocks were purchased and still held at this time.
 On June 7, 2005, I posted Harman International (HAR) on Stock Picks when it was trading at $94.77. HAR closed at $86.32 on October 6, 2006, for a loss of $(8.45) or (8.9)% since posting.
 On August 15, 2006, Harman reported 4th quarter 2006 results. Revenue for the quarter came in at $859.1 million, up 6% from last year's $808 million. Analysts, according to Thomson Financial, had expected revenue of $873.4 million. The company earned $64.8 million or $.96/share, down from last year's $70.2 million or $1.01/share. After removing "restructuring charges and senior debt buybacks", the company earned $1.09/share, ahead of expected $1.07/share excluding charges. In that department, the company exceeded expectations. However, looking ahead, the company forecast $4.35/share in 2007, which is lower than the analysts' $4.46/share expected. All-in-all, a bit of a disappointing report.
 On June 8, 2005, I posted Balchem (BCP) on Stock Picks at a price of $29.50/share. On January 23, 2006, Balchem had a 3:2 stock split, making my effective stock pick price actually $19.67. BCP closed at $19.80 on October 6, 2006, for a gain of $.13 or .7% since posting.
 On August 1, 2006, BCP announced 2nd quarter 2006 results. For the three months ended June 30, 2006, net sales increased 28.8% to $25.1 million from $19.5 million in the same quarter last year. Net earnings increased 11.9% to $3.06 million, from $2.73 million in the same quarter last year. On a per diluted share basis, net earnings increased 8.7% to $.25/share, up from $.23/share.
 Finally, on June 20, 2005, I posted Boston Beer (SAM) on Stock Picks Bob's Advice when the stock was trading at $23.08. Boston Beer closed at $33.24 on October 6, 2006, for a gain of $10.16 or 44% since posting.
On August 8, 2006, Boston Beer announced 2nd quarter 2006 results. For the quarter ended July 1, 2006, revenue climbed 28% to $87.6 million from $68.5 million last year. Profit came in at $8 million or $.56/share, up 60% from $.35/share last year. This, according to Thomson Financial, exceeded analysts' expectations of $.38/share. The company also raised guidance for 2006 full year to $1.16 to $1.31, (excluding stock option expenses of $.06 to $.11), this was up from prior guidance between $1.10 to $1.18/share. Thus, this was a great earnings report, with strongly improving revenue and earnings, and also exceeding expectations and raising guidance!
So how did I do with these three stocks? Well, I had one small loss, one break-even, and one strong gain for an average performance of a gain of 11.9% for this week a bit over a year ago!
Thanks so much for stopping by and visiting! If you have any comments or questions, please feel free to drop me a line at bobsadviceforstocks@lycos.com. I cannot promise to answer every email I receive, but I read all of them and share many of the comments here and on my podcast. Speaking of which, be sure and visit my Stock Picks Podcast Site, where I also discuss many of these same stocks in an audio show.
Bob
Posted by bobsadviceforstocks at 10:15 PM CDT
|
Post Comment |
Permalink
Updated: Saturday, 7 October 2006 10:16 PM CDT
Newer | Latest | Older


