Stock Picks Bob's Advice
Friday, 7 April 2006
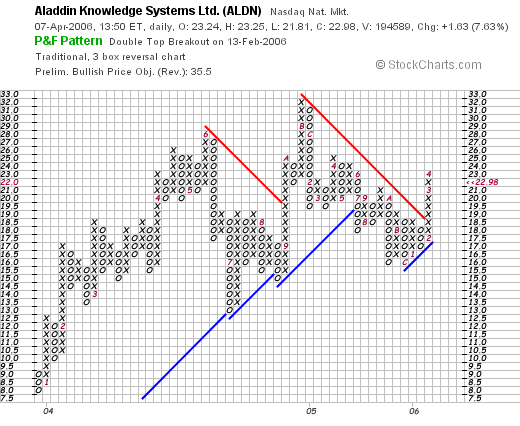
April 7, 2006 Aladdin Knowledge Sys (ALDN) Revisiting a Stock Pick
Click ***HERE*** for my PODCAST ON ALADDINHello Friends! Thanks so much for stopping by and visiting my blog,
Stock Picks Bob's Advice. As always, please remember that I am an amateur investor, so please remember to consult with your professional investment advisors prior to making any investment decisions based on information on this website.

I was looking through the
list of top % gainers on the NASDAQ today and came across Aladdin Knowledge Systems (ALDN) which, as I write, is trading at $22.96, up $1.61 or 7.54% on the day. This company is an old favorite of mine, having
posted ALDN on Stock Picks Bob's Advice on March 25, 2005, when it was trading at $23.26. The stock is thus virtually unchanged (just down $.30/share) since the stock pick. Then
why should I again post this stock on the blog?
Let's take another look at the company and I think you will be able to share my thinking about this particular stock.
First of all, why did the stock move higher today? A few hours ago, as was
reported, an analyst from Bean Murray Carret & Co., upgraded the stock to "Strong Buy" from "Accumulate" and raised his price target to $26. As reported in the same story, he stated:
"We believe the company's DRM business, about 70 percent of revenue, is likely to return to solid growth in the first quarter of 2006, after posting disappointing 4 percent year-over-year growth in the fourth quarter of 2005," Glukhov wrote in a note."
But let's run the stock through a few of the screens that I like to use to examine a possible investment.
First of all, what does the company do?
According to the
Yahoo "Profile" on Aladdin, the company
"...and its subsidiaries provide solutions for software digital rights management and Internet security. The company offers its products in two divisions: Software Digital Rights Management (SDRM) and Enterprise Security."
And how about the latest quarter?
On January 23, 2006, Aladdin
reported 4th quarter 2005 results. For the quarter ended December 31, 2005, revenues climbed 16% to $21.8 million from $18.8 million in the same period of 2004. GAAP net income for the fourth quarter of 2005 was $3.9 million or $.27/diluted share, up 48% from the same quarter the prior year when net income was $2.6 million or $.20/diluted share.
How about longer-term?
Checking the
Morningstar.com "5-Yr Restated" financials, we can see the steady growth in revenue from $44.3 million in 2000 to $69.1 million in 2004.
Earnings have been erratic, dropping from $.12/share in 2000 to a loss of $(1.32)/share in 2001. Since 2001, earnings have gradually improved to $.68/share in 2004. The company has not expanded the stock supply significantly, with 11 million shares in 2000, increasing to 12 million in 2004.
Free cash flow has been positive and growing, with $3 million in 2002, $5 million in 2003 and $8 million in 2004.
The balance sheet, as reported on Morningstar.com looks nice with $25.9 million in cash and $22.7 million in current liabilities. Combined, this yields a current ratio of almost 3.5. In fact, the cash alone is enough to pay off the current liabilites and the long-term liabilities of $3.1 million combined.
What about some valuation numbers on this stock?
Reviewing
, we can see that this is a small cap stock with a market capitalization of only $331.57 million. The trailing p/e is moderate at 27.12, but the forward p/e is even nicer (fye 31-Dec-07) at 17.81. Thus, with the growth anticipated, the company trades at a PEG of only .95.
According to the
Fidelity.com eresearch website, ALDN sports a fairly reasonable Price/Sales ratio within the "Security Software & Services" industrial group. Topping this group is Check Point Software (CHKP) with a Price/sales ratio of 8.1. Next is McAfee (MFE) with a ratio of 4.3, RSA Security (RSAS) at 4.2, Aladdin at 3.9 and Safenet (SFNT) at 2.5.
Yahoo shows 14.4 million shares outstanding with 9.68 million that float. As of 3/10/06, there were 1.14 million shares out short representing 8.8 days of average trading volume (the short ratio). With this well over my cut-off of 3, this looks significant, and there may be some scrambling among short-sellers, in the face of the analyst upgrade, to buy shares to cover their 'shorts'.
Yahoo shows no cash dividend and the last stock split was a 3:2 on 9/18/95.
What about a chart?
Reviewing the
"Point & Figure" chart on Aladdin from StockCharts.com, we can see that the stock actually moved strongly higher from $8 in December, 2003, to a high at $28 in June, 2004, until falling back to $13.50 in July, 2004. The stock climbed once again to $32 in August, 2004, and corrected again to $16 in late 2005. However, the stock is once again on the move higher, having broken through resistand at $18 in February, 2006. The chart is not overly impressive in terms of price momentum to the upside, but appears to overall be moving higher at this time. It certainly does not appear over-extended!
So what do I think? Well, the latest quarterly report was strong, and with all of the shares out short, there may well be a bit of a squeeze we are witnessing subsequent to the analyst upgrade today. The Morningstar results look nice with a steady picture of revenue growth, and overall earnings improvement. Valuation is reasonable with a PEG under 1.0, and a Price/Sales near the bottom in its group. Free cash flow is positive and growing and the balance sheet looks nice.
Finally, the chart which overall appears to be moving higher, does not overwhelm this observer in its bullish bias. The chart is a bit weak, but with all of the great numbers, I think it more likely that the stock rise will once again renew.
Thanks again for stopping by! If you have any comments or questions please feel free to leave them on the blog or email me at bobsadviceforstocks@lycos.com.
Bob
Posted by bobsadviceforstocks at 1:31 PM CDT
|
Post Comment |
Permalink
Updated: Friday, 7 April 2006 11:08 PM CDT
Thursday, 6 April 2006
Readers Write: Questions about XOM, BNT, and OSK
Hello Friends! Thanks so much for stopping by and visiting my blog,
Stock Picks Bob's Advice. As always, please remember that I am an amateur investor, so please remember to consult with your professional investment advisors prior to making any investment decisions based on information on this website.

I always enjoy receiving notes and letters from readers and if you would like to drop me a line, you can reach me at bobsadviceforstocks@lycos.com. You can also leave comments after each entry. I will try to read and respond to as many of these comments and letters as I can. Please remember that I truly am an amateur, so for more definitive responses, please consult with your professional investment advisors.
There are three emails that I have been meaning to get around to commenting on. So please excuse me if it has taken me awhile to get back to you on these notes.
The first email was from Imran V. who wrote:
"Dear Bob, Good Morning, I will appreciate if you can kindly review
ExxonMobil (XOM). Have a good day. Sincerely yours, Imran"
First of all, I do not own any shares of ExxonMobil but I believe my children own a few shares that they received as gifts from their Grandmother several years back.
Before I comment on XOM, I would like to point out that I generally like to avoid commodity type stocks, which although they can be extremely profitable, are at the mercy of the price of the underlying material they are involved in exploring for, processing, or retailing. Thus Exxon's fortunes have been tied to the price of oil, which since it has been skyrocketing, has pushed all of the oil stocks higher. While I do not expect a collapse in the oil market, and suspect that it would be advisable for all investors to have some exposure to these companies, I like to invest in stocks with some kind of product or service that can be purchased independent of any price of a particular material.
That being said, let's take a look at two things with each of these stocks: the Morningstar.com report and a "point & figure" chart from Stockcharts.com.
First ExxonMobil (XOM). Reviewing the
"5-Yr Restated" financials on XOM from Morningstar.com we find that revenue, except for a slight dip from $208.7 billion in 2001, to $200.9 billion in 2002, has grown steadily to $370.7 billion in 2005.
Likewise, earnings, which also dropped from $2.17/share in 2001, to $1.61/share in 2002, have since grown steadily to $5.71/share in 2005.
Free cash flow has been solid and growing from $15.6 billion in 2003 to $34.3 billion in 2005.
The balance sheet is also solid with $28.7 billion in cash, $44.7 billion in other current assets, giving us a current ratio of approximately 1.5 when compared to the $46.3 billion in current liabilities. The company has an additional $50.8 billion in long-term liabilities.
What about the chart? Looking at the
"Point & Figure" chart on XOM from StockCharts.com:
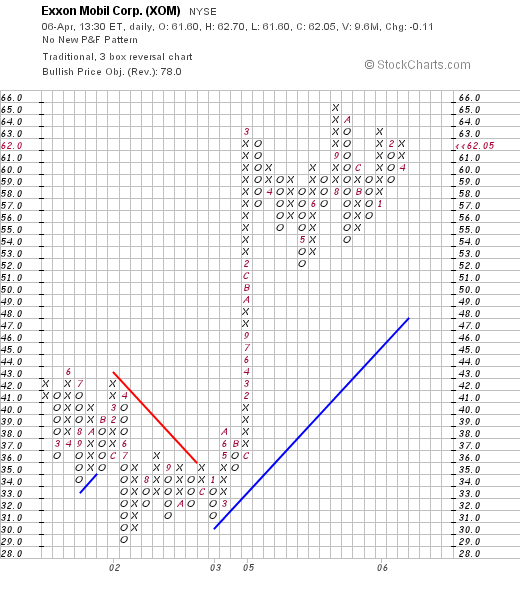
We can see that the stock was actually trading lower between February, 2001, when the stock was at $42/share, down to a low of $29/share in July, 2002. However, in 2004 and 2005, the stock moved almost straight higher to $64, where it has been trading in a fairly tight range between $52 and $65 since. The chart looks bullish, and if the oil prices hold up, I wouldn't be surprised to see this stock move higher from this level.
So what do I think? Well, as I said, it is not my kind of stock. As long as the oil price remains high, the stock is likely to continue to move higher with the large amount of free cash flow and profits the stock is generating. The company is likely to increase its dividend and buy back shares as well as it scrambles to do something with the piles of cash it is accumulating.
Next question. I received a nice email from Jason T.B. who wrote:
"Hello My name is Jason. I'm a 28 year old new investor and I was thinking about buying some BNT stock. If you don't mind what do you think about this stock pick.
Thanks for your help,
Jason T. B."
First of all, thank you for writing Jason! I hope that my amateur perspective can also be helpful for you, but that you remember, like I advise all of my readers, to find a professional advisor who can assist you with your investing decisions.
I do not own any shares of Bentley Pharmaceuticals (BNT) but I have written about this stock twice on this blog. You might want to review my first
discussion of Bentley on Stock Picks Bob's Advice on October 3, 2003, and then my
revisit on November 21, 2005.
Let's take one more brief view of this company and a look at a chart.
Looking at the
"5-Yr Restated" financials on BNT from Morningstar.com, you can see the steady growth in revenue from $18.6 million in 2000 to $73.4 million in 2004 with $92 million reported in the trailing twelve months (TTM).
Earnings growth has not been quite as steady with flat earnings at $.08 in 2001 and 2002, and a dip in earnings from $.28 to $.25/share in 2004. However, earnings in the TTM have come in at $.41/share. It is not unusual to see a bit of an erratic history of earnings growth in these small companies.
Free cash flow has also been erratic with $(2) million in 2002, $0 in 2003, $(6) million in 2004 and $3 million in the TTM.
The balance sheet is solid with $36.3 million in cash and $41.8 million in other current assets, which, when balanced against the $30.9 million in current liabilities, gives us a current ratio of over 2.0. A nice point is the fact that the cash, $36.3 million, is adequate in itself to pay off both all of the current liabilities of $30.9 million
and the $4.8 million in long-term debt combined.
Thus, the Morningstar page looks attractive to me!
What about the chart? Taking a look at the
"Point & Figure" chart on Bentley from StockCharts.com:
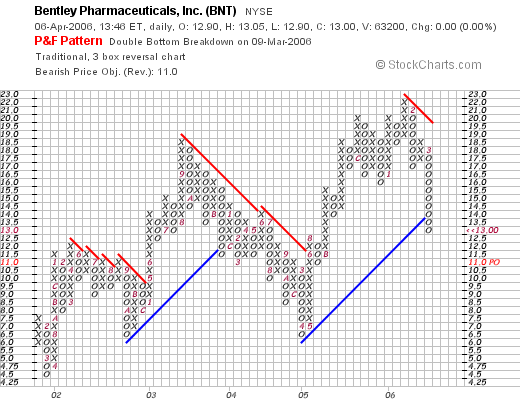
We can see that the stock actually appears to be trading weakly with a recent penetration of two year support levels. In general, I prefer to purchase shares on strength. I would like to see Bentley moving higher more convingly to suggest this would be a stock I would be buying at this time.
Finally, I had a letter from Allen T. who wrote today:
"Do you think OSK is ready to split again? or, is today's drop simple
"profit taking" ?"
Again, I do not personally own any shares of Oshkosh Truck, but my stock club did fortunately purchase some a year or so ago, and has done quite well with this company that manufactures fire trucks, garbage trucks, and military vehicles. I did not see any negative news on this company, so let's take a look at the chart. Here is a
"Point & Figure" chart on Oshkosh from StockCharts.com:
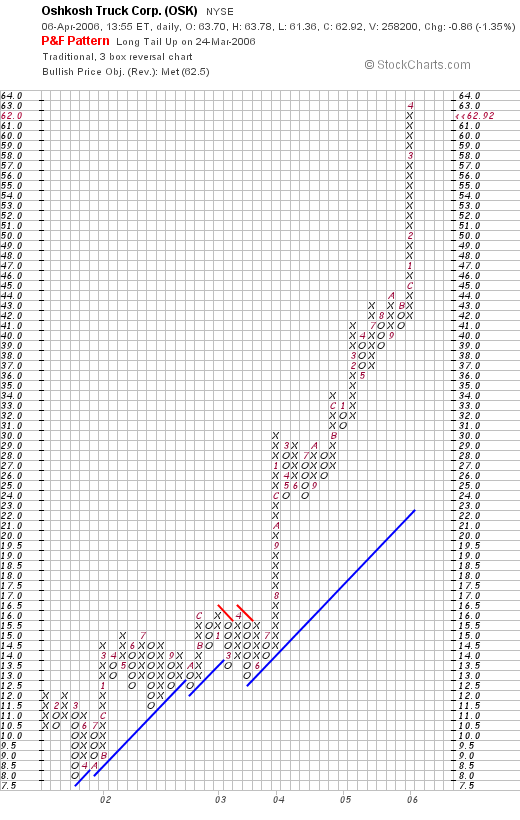
I would be hard-pressed to find any weakness at all in this stock chart. In fact, the rapid ascent in stock price means that the stock, one could say, really needs a bit of a rest, a pull-back, a bit of profit-taking, however you might put it, before moving higher once again. Without news, and in a stock that has risen dramatically the past year, I think you would be correct to call it "profit-taking". That doesn't mean you can't lose money on this stock over the short- or long-term. I just don't see anything fundamentally wrong with the company or the chart.
At least that's my amateur take on all of these questions!
Thank you all for writing and visiting here on the blog. I always hope that my words are helpful and that you might gain some additional understanding into stocks and investments after visiting here!
Bob
April 6, 2006 Immucor (BLUD)
Click ***HERE*** for my PODCAST ON IMMUCORHello Friends! Thanks so much for stopping by and visiting my blog,
Stock Picks Bob's Advice. As always, please remember that I am an amateur investor, so please remember to consult with your professional investment advisors prior to making any investment decisions based on information on this website.

The market is in a bit of a correction today, but that doesn't stop me from looking for stocks of interest! In fact, looking through the
list of top % gainers today, I came across Immucor (BLUD) which seems to fit the criteria on this blog quite well. I do not own any shares nor do I have any options on this stock. As I write, BLUD is trading at $30.76, up $2.00 or 6.95% on the day.
Let's run through this stock so that I can share with you my thinking on why it looks attractive.
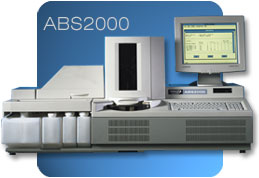
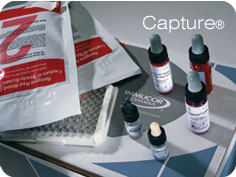
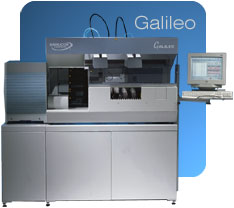
First of all its business. According to the
Yahoo "Profile" on Immucor, the company
"...engages in the development, manufacture, and marketing of immunological diagnostic medical products primarily in North America and Europe. It offers a line of reagents and automated systems that are used by hospitals, clinical laboratories, and blood banks in various tests performed to detect and identify various properties of cell and serum components of human blood."
It was the
announcement of 3rd quarter results after the close of trading yesterday that resulted in the sharp rise of the Immucor stock price in today's trading. Immucor reported that for the third quarter 2006 ended February 28, 2006, revenues grew 24% to $47.1 million from $38.0 million in the same quarter last year. Net income came in at $11.7 million, up 81% from the $6.5 million the prior year same period. On a per share basis, this was $.25/share, up strongly from $.14/share on actually 500,000 fewer shares outstanding. In addition, the company provided strong guidance for the upcoming quarter:
"The company expects revenues for the fiscal year ending May 31, 2006 to range from $180.0 million to $183.0 million, an increase of approximately 24% to 26% over fiscal 2005 revenues. Gross margin is expected to be in the range of 65% to 66%. Net income is expected to be in the range of $38.3 million to $40.6 million, an approximate 62% to 70% increase over fiscal 2005. We expect to generate earnings per diluted share in the range of $0.81 to $0.85 for the fiscal year."
What about longer-term results?
For that, let's review the
"5-Yr Restated" financials on Morningstar.com on BLUD.
First of all, looking at revenue growth, BLUD presents a very nice picture with steady growth from $69.8 million in 2001 to $144.8 million in 2005 and $166.5 million in the trailing twelve months (TTM).
The earnings picture is almost as nice, with a loss of $(.22)/share in 2001, improving to income of $.23/share in 2003. Earnings improved steadily except for a hiccup in 2004 when earnings dropped to $.27/share from $.31 the prior year. Otherwise, after that, earnings resumed their march higher with $.50/share reported in 2005 and $.65/share in the TTM. The number of shares, which grew from 37 million in 2002 to 45 million in 2005, has now dropped slightly to 44 million in the TTM. This was noted in the earnings report and is a nice development for Immucor.
Free cash flow has been positive and steadily increasing from $15 million in 2003 to $35 million in 2005 and $47 million in the TTM.
How about the balance sheet? Morningstar.com reports BLUD with $36.4 million in cash and $61.2 million in other current assets. This combined $97.6 million, when balanced against the $28.1 million in current liabilities yields a current ratio of greater than 3. Anything 1.5 or higher looks nice. This balance sheet is solid.
In addition, the company has $15 million in long-term liabilities.
How about some valuation numbers on this stock?
Reviewing
Yahoo "Key Statistics" on Immucor, we can see that this is a mid-cap stock with a market capitalization of $1.37 billion. The trailing p/e is a bit rich at 47.59, but with the fast growth anticipated, the forward p/e (fye 31-May-07) is a more reasonable 27.20 and results in a PEG (5 yr expected) of only 1.15. Thus valuation from at least this perspective doesn't look too rich.
Examining the
Fidelity.com "eresearch" website for some additional information, we can see that Fidelity assigns BLUD to the "Diagnostic Substances" industrial group.
Within this group, BLUD is moderately priced with a Price/Sales ratio of 8.2. Topping this group is Human Genome Sciences (HGSI) with a Price/Sales ratio of 71.5, followed by Myriad Genetics (MYGN) at 9.3. Immucor is next at 8.2, Digene (DIGE) at 6.1, QLT (QLTI) at 2.9 and Dade Behring (DADE) brings up the rear at 1.9. Thus, while no screaming bargain from this perspective, valuation does not appear to be out of line in terms of other stocks in the same group.

Going back to Yahoo for a few more numbers on this stock, we can see that there are 44.43 million shares outstanding with 43.88 million of them that float. Currently there are 1.72 million shares out short representing 5.7 trading days of volume. Using my own "3 day rule" on short interest, this looks significant and may well be adding to the buying pressure driving this stock higher. It does look like the short-sellers may be throwing in the towel on this company, for the prior month, the short interest was at 1.93 million shares.
No cash dividend is paid, and the last stock split was a 3:2 split on December 14, 2004.
What about the chart?
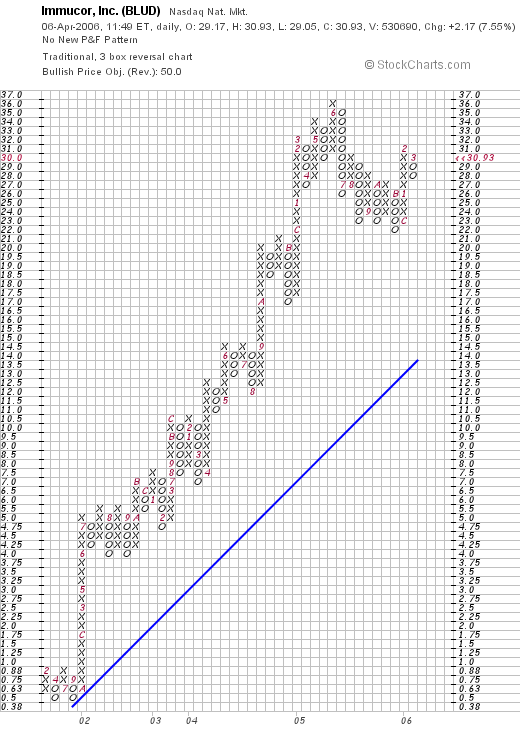
If we review a
"Point & Figure" chart on BLUD from StockCharts.com, we can see that this stock, after consolidating at the $.50/share level in 2001, climbed strongly higher in 2002 to $5/share, and then surged ahead from July, 2002, to a high of $36 in June, 2005. The stock corrected down to a level of $22 in November, 2005, until once again moving higher to the current $31 level range. The chart looks strong as well!
So what do I think? Well, I like this stock a lot. The latest quarterly result was superb, the Morningstar analysis looks terrific, free cash flow is positive and growing and the balance sheet is strong. While the p/e ratio is a bit high in the 40's, with the rapid growth, the forward p/e drops in to the 20's and the PEG is just over 1. Even the Price/Sales, which is also a bit richly valued may be worth it. Just my thought anyhow!
Unfortunately, I am not in the market to be buying any stocks. But if I were..... Anyhow, thanks so much for stopping by and visiting! If you have any comments or questions, please feel free to leave them on the blog or email me at bobsadviceforstocks@lycos.com.
Bob
Posted by bobsadviceforstocks at 11:13 AM CDT
|
Post Comment |
Permalink
Updated: Thursday, 6 April 2006 10:17 PM CDT
Wednesday, 5 April 2006
April 5, 2006 Apple Computer (AAPL)
Hello Friends! Thanks so much for stopping by and visiting my blog,
Stock Picks Bob's Advice. As always, please remember that I am an amateur investor, so please remember to consult with your professional investment advisors prior to making any investment decisions based on information on this website.

I was browsing through the
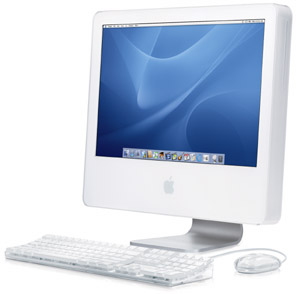
list of top % gainers on the NASDAQ and came across Apple Computer (AAPL) which closed today at $67.21, up $6.04 or 9.87% on the day. I do not own any shares nor do I have any options on this stock. I have had several Apple computers, including the Apple IIc, an Apple LCII, a Power Mac with a 603 chip, an iMac, and now I also own an iMac with the computer built into the monitor. I am waiting to purchase an Intel-based Apple eventually :). You can see, that while I haven't owned any shares for quite awhile, I am a fan of their computers. (I should note that I am writing this entry this evening on an HP computer that is Windows-based!).
Let's take a closer look at this company and the stock and I will show you why I now feel it is worth including on this blog.
According to the
Yahoo "Profile" on Apple, the company
"...engages in the design, manufacture, and marketing of personal computers and related software, services, peripherals, and networking solutions worldwide. It also offers a line of portable digital music players, accessories, and services. The company’s products and services include Macintosh line of desktop and notebook computers; iPod digital music player; Xserve G5 server and Xserve RAID storage products; a portfolio of consumer and professional software applications; Mac OS X operating system; iTunes Music Store; and a portfolio of peripherals that support and enhance the Macintosh and iPod product lines."
One of the great attractions of this computer has been its proprietary operating system that unfortunately, has limited compatability with the Windows world. The loyal Mac fans (and I count myself among them) have been forced to own a Windows machine in addition to the Mac so that the mainstream software is accessible to them. This limitation has held back widespread acceptance of Apple computers, and it was this reason that led to the big spike in price today. As
reported:
"Apple, with about 3 percent of the worldwide PC market, said the "Boot Camp" software, available immediately as a download, enables Macs to run either Windows XP or the Mac OS X operating software."
Enabling the Macintosh computer to run Windows XP, especially with the new speedy Intel chips, will offer some not-so-diehard Macintosh fans, an opportunity to live in both the Windows and Macintosh world, sort of getting the best of both systems.
And what about the latest quarterly report?
On January 18, 2006, Apple
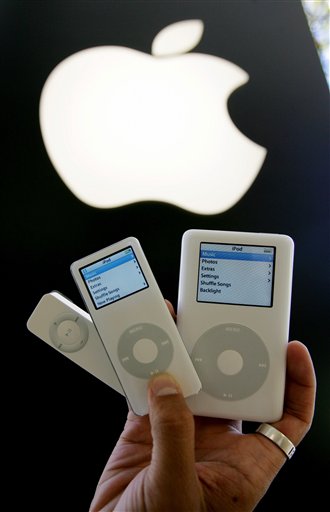
reported 1st quarter 2006 results. For the quarter ended December 31, 2005, revenue came in at $5.75 billion, a $2.26 billion or a 65% increase over last year's revenue of $3.49 billion during the same period. Net profit came in at $565 million, up $270 million or a 92% increase over last year's $295 million result. On a per share basis, this came in at $.65/diluted share, up $.30 from $.35/share or an 86% increase over the prior year's results. Other nice numbers in the report was a 20% increase in Macintosh sales to 1.25 million, and a 207% increase in iPod sales to 14 million iPods during the quarter.
How about longer-term results?
Looking at the
Morningstar.com "10-Yr Income" Statement, revenue actually declined from $11.6 billion in 1995 to a low of $5.4 billion in 2001. Since 2001, as we examine the
Morningstar.com "5-Yr Restated" financials on AAPL, we can see that revenue turned around and started growing once again, with $5.4 billion in 2001, increasing to $13.9 billion in 2005 and came in at $16.2 billion in the trailing twelve months (TTM).
Earnings have also been improving the past five years. Apple reported a loss of $(.04)/share in 2001, turned profitable at $.09/share in 2002, and then grew earnings rapidly to $1.56/share in 2005 and $1.86 in the TTM.
Apple has increased its float slightly from 714 million shares in 2001 to 809 million in 2005 and 849 million in the TTM. As a comparison, looking at the
DELL "5-Yr Restated" financials on Morningstar, we see that revenue at Dell has grown from $31.9 billion in 2001 to $49.2 billion in 2005, earnings during this period grew from $.79/share in 2001 to $1.18 in 2005, and the number of shares has actually decreased slightly from 2.6 billion in 2001 to 2.5 billion in 2005. With Apple selling less that one-fourth of the revenue of Dell, there certainly appears to be room for Apple to continue its growth if it can find the appropriate products for the market.
Reviewing the rest of the page on Morningstar, we can see that the company is generating lots of cash with $3.2 billion in free cash flow in 2003 increasing to $4.8 billion in 2005 and $4.4 billion in the TTM.
The balance sheet is o.k. but there are a lot of current liabilities to deal with. As Morningstar reports, the company has $9.3 billion in cash, $8.3 billion in other current assets. This sounds great, but when balanced against the $15.2 billion in current liabilities, gives us a current ratio of almost 1.2. (I use 1.5 as a cut-off for a "healthy" balance sheett). Fortunately, the long-term liabilities are also a little light at only $2.8 billion.
And how about some valuation statistics on this company?
Looking at
Yahoo "Key Statistics" on Apple, Yahoo shows that the company has a market cap of $57.04 billion, making this a large cap stock. The trailing p/e is moderately rich at 36.25, with a forward p/e of 25.75. With the rapid earnings growth, the PEG ratio comes in at 1.25. I consider PEGS between 1.0 and 1.5 as 'good' values, under 1.0 as cheap and over 1.5, as relatively richly priced. Thus, from this parameter, the stock looks reasonably priced.
According to the
Fidelity.com "eresearch" website, Apple is sitting in the "Personal Computers" industrial group and is the most expensive as measured by the Price/Sales ratio, coming in at a ratio of 3.3. This is followed by Dell (DELL) with a Price/Sales ratio of 1.3, and Gateway (GTW) with a Price/Sales ratio of 0.2.
Finishing up the Yahoo statistics, Apple has 848.61 million shares outstanding with 838.17 million that float. As of 3/10/06, there were 24.42 million shares out short representing 2.90% of the float, with a short ratio of 0.8. There is relatively a low level of sales out short on this company.
No dividends are reported by Yahoo, and the last stock split was 2:1 on 2/28/05.
What about the chart?
Reviewing the
"Point & Figure" chart from StockCharts.com:
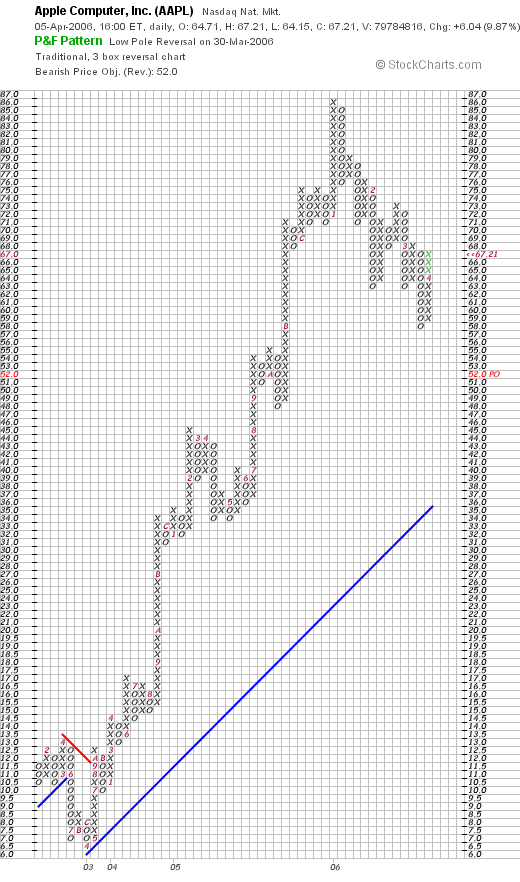
We can see that the stock, after dipping from $13/share in April, 2002, to a low of $6.50/share in April, 2003, the stock has climbed strongly to a high of $86/share in January, 2006. The stock has actually pulled back to $58 in March, 2006, before the current push higher to the $67 level. The stock is still trading almost $20 under its high, so while the chart does appear a bit over-extended (above its support line), the stock is under its recent high.
So what do I think? Well, I like the product which is my "Peter Lynch" take on the stock. The news about the computer being able to run Windows is bullish for sales, the latest quarterly report was solid, the past five years have been dynamic with a rapid growth in both earnings and revenue. Free cash flow is strong, and the balance sheet is o.k. Valuation is a bit rich by p/e, but the PEG at 1.25 is reasonable although the Price/Sales makes this the most expensive in the group of three that includes Dell and Gateway. Finally the stock chart looks great!
I never can tell if I am "too late" when picking a stock. Sometimes I am. But often, what looks like being late, turns out to be right on time as the stock often continues to rise when all of the ingredients are present for continued success. Time will tell!
Thanks so much for stopping by and visiting! If you have any comments or questions, please feel free to email me at bobsadviceforstocks@lycos.com or just leave your words right on the website itself!
Bob
"Trading Transparency" St Jude Medical (STJ)
Hello Friends! Thanks so much for stopping by and visiting my blog,
Stock Picks Bob's Advice. As always, please remember that I am an amateur investor, so please remember to consult with your professional investment advisors prior to making any investment decisions based on information on this website.
As I like to do, I wanted to update you with an actual trade I just made in my trading account. A few moments ago I sold my remaining 180 shares of St Jude Medical (STJ) at $36.23. These shares had been purchased 10/15/03 at a cost basis of $28.90/share so I had a gain of $7.33 or 25.4%.
So
why did I sell my shares? STJ got my attention today when examining my list of stocks I noted that the stock was selling at $36.30 (currently) down $(5.00) or (12.11)%. Looking through the news I found this
story on first-quarter outlook where the company noted that the upcoming quarter was going to be light on both profit and revenue and cut projections. This is a case of
lowered guidance, which had the exact opposite effect of all of those reports by companies I like to refer to which include
raised guidance! Thus, the stock dipped.
My own instinct was to stay the course so to speak. I do not see anything in this news that says the company is not a great investment, etc., etc., but another fact came to light. I realized, that since I had purchased this stock in October, 2003, I had made two sales of partial positions on gains involving thirty shares sold 1/28/04, and another 60 shares sold on 7/20/05. With my second sale at a 60% appreciation level, my strategy calls for me to unload my remaining shares if the stock should retrace 50% of my highest sale point, which would be back to a 30% gain. Thus, with today's drop, the stock also hit a sale point for me on the downside and I pulled the plug!
Anyhow, that's what happened. Again with my portfolio management system, this sale doesn't really change anything. I don't get to buy another position to replace STJ because this sale was on "bad news". However, I have a couple of stocks that appear ripe for a sale on the upside, so I shall be waiting for that event before adding a new stock to the mix.
Would I ever revisit STJ? Absolutely. It just has to be at the right place at the right time and I shall be rebuying shares. But with so many other stocks to choose from, it is unlikely that I shall be owning shares of this company in the near future.
Thanks again for visiting! If you have any comments or questions, please feel free to email me at bobsadviceforstocks@lycos.com or just leave your comments right on the website.
Bob
Tuesday, 4 April 2006
CheckFree (CKFR) Revisiting a Stock Pick
Hello Friends! Thanks so much for stopping by and visiting my blog,
Stock Picks Bob's Advice. As always, please remember that I am an amateur investor, so please remember to consult with your professional investment advisors prior to making any investment decisions based on information on this website.
I was looking through the
list of top % gainers on the NASDAQ and came across CheckFree Corp (CKFR), which closed at $54.14, up $4.16 or 8.32% on the day. I do not own any shares of this stock nor do I have any options on CKFR.

I first
posted CheckFree on Stock Picks Bob's Advice on January 21, 2005, when it was trading at $38.82. With today's close at $54.14, this represents a gain of $15.32 or 39.5% since posting. I generally like to wait at least a year before revisiting a stock, and thus, since it has been more like 15 months since I last reviewed CKFR, let's take another look at this stock and I will show you why I think it deserves a place on this blog.
First, what the company does. According to the
Yahoo "Profile" on CheckFree, the company
"...through its subsidiary, provides financial electronic commerce products and services. The company operates in three divisions: Electronic Commerce, Software, and Investment Services."
Next, how did the company do in its latest quarter? On January 24, 2006, CKFR
announced 2nd quarter 2006 results. Total revenues for the quarter ended December 31, 2005, increased to $215.9 million from $185.8 million the prior year same period. Net income more than doubled to $33.8 million from $13.0 million the prior year. On a per share basis, diluted income per share grew to $.36/share up from $.14/share in the same period last year. In an important comment within the earnings report, CFO David Mangum raised guidance for future financial results. As reported in the report:
"Strong financial results through the mid-point of the fiscal year put the Company on track to exceed its previously announced fiscal year expectations," said CheckFree Chief Financial Officer David Mangum. "We now expect full-year earnings per share in the range of $1.19 to $1.24 on a GAAP basis and $1.62 to $1.66 on an underlying basis. Free cash flow remains targeted for about $170 million for fiscal 2006."
"For the third quarter of fiscal 2006, we expect revenue in the range of $217 million to $222 million, and GAAP earnings per share in the range of $0.27 to $0.30," Mangum continued. "This expectation equates to underlying earnings per share in the range of $0.36 to $0.38 for the quarter."
Raising financial guidance is almost always bullish for the stock price imho.
What about longer-term results? If we review the
Morningstar.com "5-Yr Restated" financials on CKFR, we can first of all see that revenue has been steadily growing from $433.3 million in 2001 to $757.8 million in 2005 and $825.9 million in the trailing twelve months (TTM).
While the company was losing significant amounts of money between 2001 and 2003, in 2004 it turned profitable with $.11/share reported, growing to $.50/share in 2005 and $.94/share in the TTM.
The company
has increased its shares outstanding, but at a much slower rate than the growth in revenue, for as reported, there were 81 million shares in 2001, growing to 90 million in 2005 and 91 million in the TTM.
Free cash flow has been strongly positive with some irregular growth apparent. $129 million was reported in 2003, increasing to $170 million in 2005 and $164 million in the TTM.
The balance sheet looks very nice to me with $340.5 million in cash reported on Morningstar.com. I always like when the cash is sufficient to pay off
both the $249.3 million in Current Liabilities and the $31.5 million in Long-term Liabilities combined. In addition, with the $306.6 million in other current assets, this amount, when added to the $340.5 million in cash, and compared to the $249.3 million in current liabilities, yields a 'current ratio' of approximately 2.5.
What about some valuation numbers on this stock?
Looking at the
Yahoo "Key Statistics" on CheckFree, we find that this is a large cap stock with a market capitalization of $4.94 billion. The trailing p/e is a bit rich at 57.53, and the forward p/e (fye 30-Jun-07) is a bit nicer at 28.95. However, even with the estimated growth, valuation is a tad rich with a PEG of 1.66.
Looking at the relative valuation of the Price/Sales ratio, and using the
Fidelity.com eresearch website, we can see that Fidelity has assigned CheckFree to the "Internet Software and Services" industrial group. 'Priciest' in the group is Salesforce.com with a Price/Sales ratio of 14.2. This is followed by Websense at 6.4, then CheckFree at 3.2, VeriSign at 3.9, CheckFree at 3.2, and Internet Security Systems at 3.4. Thus, by this parameter, CKFR doens't look too out of line.
Going back to Yahoo for some more "Key Statistics" we find that there are 91.27 million shares outstanding with 76.35 million that float. As of 3/10/06, there were 8.19 million shares out short. This is quite significant imho, and represents 9.60% of the float or 12.4 trading dys of average volume. Part of the stock price climbing today may well represent a "squeeze" of the short sellers.
What about a chart? Reviewing the
"Point & Figure" chart on CKFR from StockCharts.com:
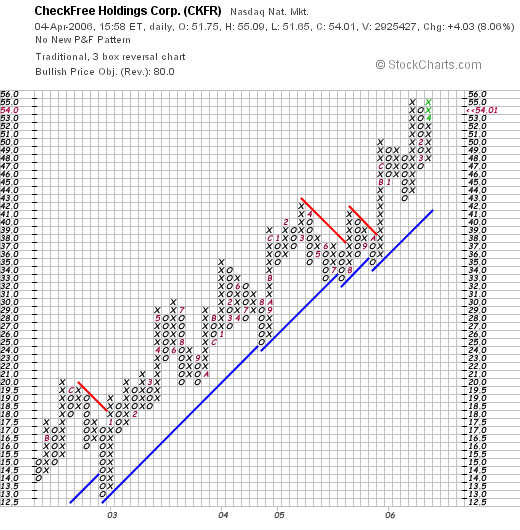
We can see what appears to be a steady increase in stock price after a short-term pull-back from $20/share to a low of $12.50/share in 2002. However, starting in January, 2003, when the stock broke through resistance at $18/share, the stock price has gradually been moving higher to the current $54 level. This chart looks quite strong to me!
So what do I think about this stock? Well, the strong move today in light of the relatively large number of shares out short is encouraging. The company reported a sold quarterly result with outstanding earnings growth. In the same report management raised guidance. Valuation appears a tad rich but not really bad when considering the rapid growth prospects. Even so, the PEG at just over 1.5 isn't too rich and the Price/Sales is in the lower part of its industrial group.
The past five years have shown significant earnings improvement while revenue has continued to grow. Free cash flow is positive and the balance sheet is solid. On top of this the chart is quite strong without appearing over-extended.
Thanks so much for stopping by and visiting! If you have any comments or questions, please feel free to leave them on the blog or email me at bobsadviceforstocks@lycos.com.
Bob
Saturday, 1 April 2006
"Looking Back One Year" A review of stock picks from the week of January 10, 2005

Hello Friends! Thanks so much for stopping by and visiting my blog,
Stock Picks Bob's Advice. As always, please remember that I am an amateur investor, so please remember to consult with your professional investment advisors prior to making any investment decisions based on information on this website.
If you are a regular visitor to this website, you will probably understand what I do with this weekend reviews: looking back at stocks I have picked with a trailing 60 week period. However, if you are new, let me explain that I like to discuss stocks of possible interest on this blog, occasionally pick from these stocks to add to my own portfolio, and like to review past selections to see how they actually turned out a year-or-so later.
My review assumes a "buy and hold" strategy which is not what I actually do or recommend in my own portfolio. In fact I recommend selling losing stocks quickly and completely and selling my gaining stocks partially and slowly.
Anyhow, last weekend I reviewed the week of January 3, 2005, and this week, I shall take a look at picks from the week of January 10, 2005.

On January 10, 2005, I
posted Pilgrim's Pride (PPC) on Stock Picks Bob's Advice at a price of $32.52. PPC closed at $21.67 on 3/31/06 for a loss of $(10.85) or (33.4)%.

On January 23, 2006, Pilgrim's Pride
announced 1st quarter 2006 results. Sales for the quarter dropped 2% to $1.34 billion from $1.37 billion last year. Earnings were down sharply to $25.7 million, from $48.5 million or $.39/share down from $.73/share last year.

On January 11, 2005, I
posted Plantronics (PLT) on Stock Picks Bob's Advice when it was trading at $40.05. PLT closed at $35.43 on 3/31/06 for a loss of $(4.62) or (11.5)%.
On January 24, 2006, Plantronics
reported 3rd quarter 2006 results. Revenue for the quarter ended December 31, 2005, climbed nicely to $222 million from $150 million the prior year. However, net income dropped to $22 million or $.42/share from $24 million or $.48/share the prior year.

On January 13, 2005, I
posted Ventana Medical Systems (VMSI) on Stock Picks Bob's Advice when it was trading at $64.36. VMSI had a 2:1 stock split on 3/15/05, giving me an effective pick price of $32.18. VMSI closed at $41.77 on 3/31/06 for a gain of $9.59 or 29.8%.

On February 10, 2006, Ventana
reported 4th quarter 2005 results. For the quarter ended December 31, 2005, sales rose 13% to $54.3 million from $48.0 million the prior year. GAAP Net Income was also up nicely at $10.6 million or $.29/diluted share, up from $8.6 million or $.24/diluted share in the fourth quarter of 2004.

On January 14, 2005 I
posted Ask Jeeves (ASKJ) on Stock Picks Bob's Advice when the stock was trading at $29.59. On March 21, 2005, the
acquisition of Ask Jeeves by InterActive Corp (IACI) was reported. ASKJ shareholders received 1.2668 shares of IACI for each share of Ask Jeeves they owned. Interactive closed at $29.60 on 3/31/06. Thus, the current value of these 1.2668 shares = $37.50. Thus, the shares, based on a pick price of $29.59, have appreciated $7.91 or 26.7%.

Finally, on January 14, 2005, I
selected Scientific Games (SGMS) for Stock Picks Bob's Advice at a price of $25.87. SGMS closed at $35.13 on 3/31/06, for a gain of $9.26 or 35.8%.
On February 28, 2006, Scientific Games
reported 4th quarter 2005 resultsRevenues for the quarter ended December 31, 2005, rose 11% to $202.9 million from $182.6 million the prior year same period. Net income was $10.4 million or $.11/diluted share, up from $4.4 million or $.05/diluted share in the prior year same period. This was a solid report imho.
So how did I do with these five stocks?
Two stocks declined and three gained. The average performance of these five was a gain of 9.48%.
Thanks so much for stopping by and visiting! If you have any comments or questions, please feel free to leave them in the blog or email me at bobsdviceforstocks@lycos.com.
Bob
Friday, 31 March 2006
March 31, 2006 Kendle International (KNDL)
Hello Friends! Thanks so much for stopping by and visiting my blog,
Stock Picks Bob's Advice. As always, please remember that I am an amateur investor, so please remember to consult with your professional investment advisors prior to making any investment decisions based on information on this website.

I was looking through the
list of top % gainers on the NASDAQ today and came across Kendle International (KNDL) a stock that I have been meaning to write-up on this blog but just haven't gotten around to it. I do not own any shares of this stock, but I purchased 30 shares of KNDL on 2/23/06 at $32.15 for my son, who if he is reading this entry, will see why I liked it then and why I still like it now. I do not have any options on this company either.
As I write, KNDL is trading at $33.20, up $2.04 or 6.55% on the day in an otherwise anemic market with both the DOW and the NASDAQ down moderately.
And what does this company do?
According to the
Yahoo "Profile" on Kendle, the company is
"...a contract research organization, provides integrated clinical research services worldwide. The company’s services comprise clinical trial management, clinical data management, statistical analysis, medical writing, regulatory consultation, and organizational meeting management and publication services on a contract basis to the pharmaceutical and biotechnology industries."
And what about the latest quarterly result?
On February 14, 2006, KNDL
reported 4th quarter 2005 results. Net service revenues for the quarter ended December 31, 2005, came in at $52.8 million, up 10% over net revenues of $48 million in the same quarter the prior year. Earnings per diluted share came in at $.25/share up 56% from $.16/diluted share the prior year. On the same day, the company
raised earnings guidance for fiscal 2006 to $1.40 to $1.50/share up from expected $1.24, and a sharp increase from the $.88/share reported in 2005. This combined solid earnings report with raised guidance was enough to help the stock move higher!
How about longer-term?
Reviewing the
Morningstar.com "5-Yr Restated" financials on KNDL, we can see a less than perfect, yet still provocative, financial record. Revenue has grown from $156.1 million in 2000 to $215.9 million in 2004 and $243.3 million in the trailing twelve months (TTM).
Earnings have been erratic, with $(.18)/share reported in 2000, turning profitable at $.33/share in 2001, then dropping to a large loss of $(4.30) in 2002. However, since 2002, earnings have improved, turning profitable again at $.27 in 2004, and coming in at $.66/share in the TTM. No dividends are reported and the number of shares has remained relatively stable at 12 million in 2000 increasing to 13 million in 2004 and up to 14 million in the TTM.
Free cash flow has been positive recently but a bit erratic as well with $20 million in 2002, dropping to $4 million in 2004, and increasing back to $19 million in the TTM.
The balance sheet looks solid with $36.1 million in cash per Morningstar and $66.4 million in other current assets. Balanced against current liabilities of $45.7 million, yields a current ratio of a bit over 2.0. In addition, the current assets can easily pay off both the $45.7 million in current liabilities
and the $3.2 million in long-term liabilities combined more than 2x over!
What about some valuation numbers on this stock?
Reviewing the
Yahoo "Key Statistics" on Kendle, we can see that this company is a small cap stock with a market capitalization of only $466.50 million. The trailing p/e is a bit rich at 43.66, but the forward (fye 31-Dec-07) p/e is much nicer at 19.30. No PEG is reported.
According to the
Fidelity.com eResearch website, Kendle is in the "Drug Manufacturers/Other" industrial group and is very reasonably priced with a Price/Sales ratio of 1.8. Other stocks in this group include Vertex Pharmaceuticals with a Price/Sales ratio of 19.9, Millennium Pharmaceuticals with a ratio of 5.6, Forest Laboratories at 5.3 and Cephalon at 2.9. By this measure, the company appears reasonably priced.
Finishing up with Yahoo, we find that there are 14.13 million shares outstanding and 11.73 million that float. Of these, 115,550 shares are out short as of 3/10/06, representing 1% of the float or 0.5 trading days of volume (the short ratio). This doesn't look significant to me.
As previously noted, no dividends and no stock splits are reported on Yahoo.
So what about the chart?
Looking at a
"Point & Figure" chart on Kendle from StockCharts.com:
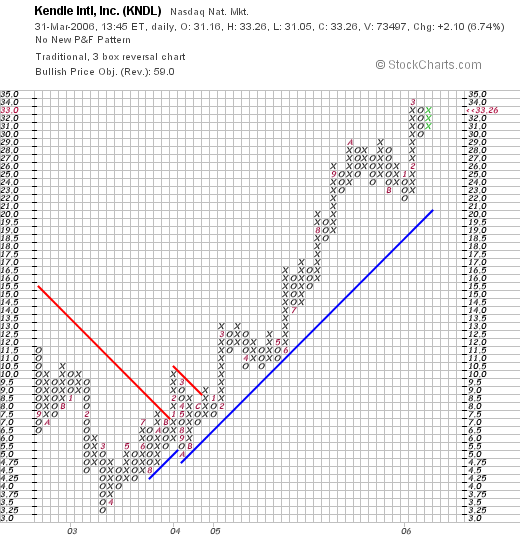
We can see that the stock price traded weakly between September, 2002, when it was at $11.50/share, down to a low of $3.25 in March, 2003. Since then, the stock has been roaring higher to the current level of approximately $33/share.
So what do I think?
Well, you know I like it enough to buy a few shares for my son :). But seriously, the stock reported a strong quarter, raised guidance, and has a nice record from the past few years at least on Morningstar.com. The company is free cash flow positive, has reasonable valuation going forward especially, and a solid balance sheet. On top of this the chart looks terrific. Simply put, I like this stock!
Anyhow, that's my Friday pick! Thanks so much for stopping by and visiting. If you have any comments or questions, please feel free to leave them on the blog or email me at bobsadviceforstocks@lycos.com.
Bob
Thursday, 30 March 2006
March 30, 2006 NS Group (NSS)
Hello Friends! Thanks so much for stopping by and visiting my blog,
Stock Picks Bob's Advice. As always, please remember that I am an amateur investor, so please remember to consult with your professional investment advisors prior to making any investment decisions based on information on this website.

The market appears to be taking a pause after yesterday's euphoric rise! However, that doesn't mean we can't keep looking for those stocks we like to discuss on this website. Reviewing the
list of top % gainers on the NYSE today, I came across NS Group (NSS), which as I write is trading at $47.09, up $1.77 or 3.91% on the day. I do not own any shares nor any options on this stock.
According to the
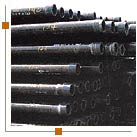
Yahoo "Profile" on NS Group, the company
"...engages in the manufacture and supply of the tubular products to the energy market in North America. The company’s energy related products include seamless and welded tubular products, such as drill pipe, casing, and production tubing used in oil and natural gas drilling and production operations."
Let's take a closer look at this stock.
First, the latest quarterly earnings report.
NSS
reported 4th quarter 2005 results on February 14, 2006. For the quarter ended December 31, 2005, net sales came in at $154.2 million, a 10% increase over the $140.0 million reported in the same quarter the prior year. Net income was up nicely at $39.8 million or $1.76/share, from $30.8 million or $1.35/share the same quarter last year. According to this
report, the company beat expectations of $1.67 on the net income, but the revenue came in a bit under expectations of $158.3 million.
How about longer-term results?
Reviewing the
Morningstar.com "5-Yr Restated' financials on NSS, we can see that revenue actually dropped from $315.5 million in 2001 to a low of $192.4 million in 2002. Since then, revenue has climbed steadily and strongly to $600.9 million in 2005.
Earnings have improved steadily since 2001 when the company posted a loss of $(2.68)/share to a profit of $3.45/share in 2004 and $5.62/share in 2005.
No dividends are paid and the shares outstanding is readily constant with 21 million shares reported in 2001, increasing to 22 million in 2005.
Free cahs flow which was negative at $(15) million in 2003, turned positive at $25 million in 2004 and $111 million in 2005.
The balance sheet is quite solid with $145.1 million in cash and $93.4 million in current liabilities. Including the $215.7 million in other current assets, this gives us a current ratio of over 3.5. In fact, the company has enough cash to pay off the combined $106 million in current and long-term liabilities with another $40 million in cash left over!
And what about some valuation numbers?
Reviewing
Yahoo "Key Statistics" on NS Group, we find that the market cap is a mid-cap size $1.06 billion. The trailing p/e is a downright cheap 8.40 with a forward p/e of 7.43. No PEG is rreported.
According to the
Fidelity.com eResearch website, this company is in the "Steel & Iron" industrial group and is moderately priced relative to its Price/Sales ratio of 1.7. Topping this group is Precision Castparts (PCP) at 2.4, followed by NSS at 1.7, and Allegheny Technologies (ATI) at 1.7. Steel Dynamics (STLD) comes in at 1.4 and Nucor (NUE) at 1.3. At the bottom of the group is Gibraltar Industries (ROCK) with a Price/Sales ratio of 0.7.
Going back to Yahoo for a few more numbers, we find that there are 22.42 million shares outstanding with only 20.20 million that float. Currently (3/10/06) there are 1.81 million shares out short which represents 8.10% of the float or 4 trading days of volume (the short ratio). Exceeding my 3 day rule for the short ratio, this is of some significance imho.
No cash dividend is reported, and no stock splits are noted on Yahoo either.
What about a chart?
Looking at the
"Point & Figure" chart on NSS from StockCharts.com:
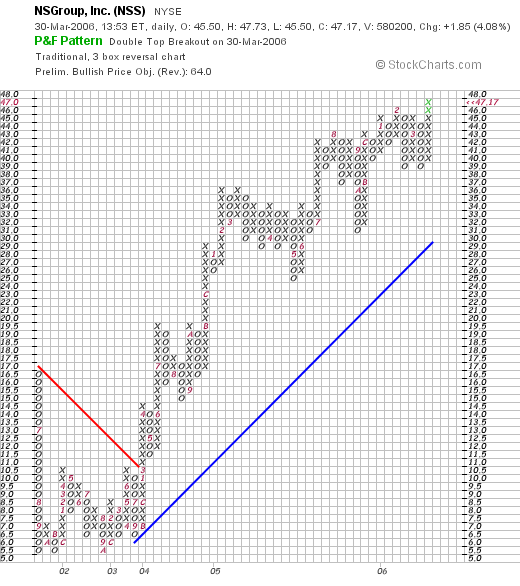
We can see that the company traded lower from $17 to a low of $5.50 in October, 2002. The company's stock price then moved higher, breaking through resistance in March, 2003, at the $10.50 level, and has subsequently been steadily moving towards the current level of approximately $47/share. The chart looks nice to me.
So what do I think? Well this is another oil-related company on the move. They have several years of steady growth, the latest quarterly result appears solid, free cash flow is positive and growing, the number of shares is stable, the balance sheet is beautiful, valuation is nice with a p/e under 10, and the Price/Sales is satisfactory. I don't have a PEG to evaluate, but it sure looks like it would be well under 1.0. Finally, the chart is solid. What is there not to like? I suppose if the oil market collapsed, this stock would go down with it, but what do you think the chances are for that?
Anyhow, thanks so much for stopping by and visiting. If you have any comments or questions, please feel free to leave them on the blog or email me at bobsadviceforstocks@lycos.com.
Bob
Tuesday, 28 March 2006
TALX Corporation (TALX) Revisiting a Stock Pick
Hello Friends! Thanks so much for stopping by and visiting my blog,
Stock Picks Bob's Advice. As always, please remember that I am an amateur investor, so please remember to consult with your professional investment advisors prior to making any investment decisions based on information on this website.
While the rest of the market and all of the traders are anxiously awaiting the Fed and the probably 1/4% interest hike, I was out looking for new prospects and re-examining old stock picks. Looking through the
list of top % gainers on the NASDAQ this afternoon, I saw an old name, almost an old 'friend'--as I like to refer to some of my old stock picks--TALX Corp (TALX) making a nice move today. As I write, TALX is trading at $28.26, up $1.84 or 6.96% on the day.

I first
wrote up TALX on Stock Picks Bob's Advice on September 17, 2003, when the stock was trading at $26.25. TALX split 3:2 2/18/05, and then split again 3:2 on 1/18/06. This gives my pick an effective price of $26.25 x 2/3 x 2/3 = $11.67. With the current (as I write) price of $28.27, this gives this stock pick a gain of $16.60 or 142.2% since selected on this blog. Unfortunately, I didn't buy any shares or options on this stock then and I don't own any shares or options now.
And what exactly does this company do?
Taking a look at the
Yahoo "Profile" on TALX, we find that the company
"...provides automated employment and income verification, tax management services, and other outsourced employee self-service applications. Its services use Web access, interactive voice response, fax, document imaging, and other technologies to enable mortgage lenders, pre-employment screeners, credit issuers, social service agencies, and other authorized users to obtain payroll and human resources information; and enables employees and their managers to review and modify information in payroll and human resources management information systems."
And how about the latest quarterly results?
On January 25, 2006, TALX
announced 3rd quarter 2006 results. Revenue for the quarter ended December 31, 2005, climbed 31% to $52.3 million from $39.8 million in the same quarter the prior year. Earnings from continuing operations climbed 54% to $7.4 million, from the year ago $4.8 million figure. On a diluted per share basis, this worked out to $.22/share up almost 50% from the $.15/share reported the prior year.
One of the most important things, imho, that may be found in a quarterly report is
new guidance. And TALX did exactly this. As reported in the report:
"Because of the favorable operating trends, as well as recent acquisitions, TALX is again raising guidance for the fiscal year ending March 31, 2006. Revenue is now estimated to be a range of $205 million to $207 million compared with previous guidance of $193 million to $196 million. On a post-split basis, the estimate for diluted earnings per share from continuing operations is now a range of $0.86 to $0.87 compared with the previous guidance of $0.80 to 0.83 ($1.20 to $1.24 on a pre-split basis)."
This looks like a nice earnings report from my perspective.
What about longer-term results? My goal for stocks is to pick companies that can consistently and persistently produce good financial reports. I cannot foretell the future, but I depend on past results to give an indication of future prospects.
Looking at the
"5-Yr Restated" financials from Morningstar.com, we see that this company is relatively new, with no meaningful revenue in 2001, growing to $35.4 million in 2002, and to $158.4 million in 2005. They reported $193.3 million in the trailing twelve months (TTM).
Earnings during this same period have grown steadily from $.01/share in 2001, to $.51/share in 2005 and $.86/share in the TTM.
An added plus, imho, is the presence of dividends. While not necessary for me to like a stock, the payment of dividends makes a company more attractive to many other investors, and also helps support a stock price in a market correction. In addition, the company has a pattern of
increasing its dividend each year! They paid $.03/share in 2001, increasing it annually to $.10/share in 2005 and $.12/share in the TTM.
The number of shares outstanding has grown slightly as the company has apparently been using shares for financing operations and acquisitions, increasing from 25 million shares in 2001 to 31 million in 2005 and 32 million in the TTM. This 33% increase in shares, while a bit more than I would like, did coincide with an approximately 500% increase in revenue. I view this as a satisfactory trade-off.
What about free cash flow? This has been steady but not growing with $24 million reported in 2003, $24 million in 2005 and $24 million in the TTM.
And the balance sheet?
Let me use this entry to touch on the top of "current ratio" that I have been using in this and other entries. Not being an accountant or finance person, I depend on other experts for explanations.
I found a nice
explanation of the current ratio where it is explained:
"The current ratio is another test of a company's financial strength. It calculates how many dollars in assets are likely to be converted to cash within one year in order to pay debts that come due during the same year. You can find the current ratio by dividing the total current assets by the total current liabilities. For example, if a company has $10 million in current assets and $5 million in current liabilities, the current ratio would be 2 (10/5 = 2).
An acceptable current ratio varies by industry. Generally speaking, the more liquid the current assets, the smaller the current ratio can be without cause for concern. For most industrial companies, 1.5 is an acceptable current ratio. As the number approaches or falls below 1 (which means the company has a negative working capital), you will need to take a close look at the business and make sure there are no liquidity issues. Companies that have ratios around or below 1 should only be those which have inventories that can immediately be converted into cash. If this is not the case and a company's number is low, you should be seriously concerned."
On many entries, I have been referring to this "1.5" figure as a cut-off for 'good health'. This is where I got this figure.
Anyhow, looking again at the Morningstar results, we can see that TALX has $7.8 million in cash and $48.7 millin in other current assets. This $56.5 million, when balanced against the $31.3 million in current liabilities, gives us a current ratio of approximately 1.8. A healthy if not spectacular figure. In addition, the company has another $132.6 million in long-term debt. With the growth in revenue, the growth in earnings, the steady free cash flow, I suspect that this debt load will not be a problem imho.
What about some valuation numbers on this company?
Reviewing
Yahoo "Key Statistics" on TALX, we find that this is a mid-cap stock with a market capitalization of $900.18 million. The trailing p/e is a moderate 32.75, with a forward p/e (fye 31-Mar-07) of 25.52. With the rapid growth in earnings expected (5 Yr expected), we are left with a PEG of .88 which is quite reasonable imho.
Insofar as the Price/Sales ratio is concerned, using the
Fidelity.com eresearch website, we can see that this stock is in the "Business Software & Services" industrial group. Within this group, TALX is actually the 'priciest' or richest in valuation with a Price/Sales ratio of 4.7. This is followed by BEA Systems (BEAS) at 4.4, First Data (FDC) at 3.6, Business Objects (BOBJ) at 3.2, Automatic Data Processing (ADP) at 3.1, and Fiserv (FISV) at 2. Thus, from this perspective, TALX is fairly richly valued.
Going back to Yahoo for a few more numbers, we find that the company has only 32.07 million shares outstanding with 29.7 million that float. Of those that float, 1.60 million shares or 5.10% of the float, is out short. This represents only 2.6 average trading days of volume (the short ratio). IMHO, this is not significant, as it is under 3 days which I have arbitrarily set to distinguish those companies which have a large number of shares out short.
As noted above, the company pays a $.16/share dividend with a yield of .60%. The last stock split, as I also noted earlier, was on 1/18/06, when the stock split 3:2, the second split in as many years.
What about a chart?
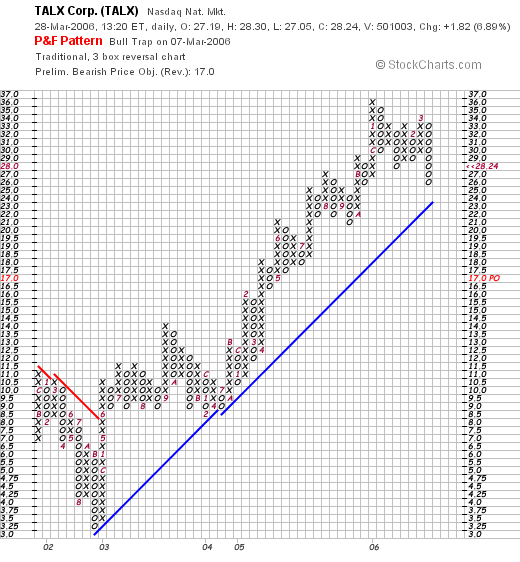
Taking a look at the
"Point & Figure" chart on TALX from Stockcharts.com, we can see that from a level of $10.50 in late 2001, to a bottom of $3.25 in October, 2002, the company showed considerable weakness in its stock price. However, after breaking through resistance at $8.00/share in May, 2003, the stock has moved steadily higher to the current $28 level.
So what do I think about this stock?
Well basically I like this stock a lot, even though I do not own any shares! The stock is making a nice move higher today apparently on an analyst upgrade. More importantly, the latest quarterly result was strong with growth in both earnings and revenue and the company raised guidance. The Morningstar evaluation looks nice with a steady growth in revenue, and also a steady growth in earnings which is often erratic in a small company like this. To top this off, the company pays a small dividend and has been raising (!) the dividend every year.
Valuation-wise, the p/e is a tad rich but the PEG is under 1.0. The Price/Sales ratio is the top in its group so no bargain there, but I am willing to endorse a stock with that particular ratio on the high end with everything else in line. On top of this, the chart looks strong.
Anyhow, that's a stock for you to chew on! I hope I haven't been too verbose, but if so, let me know and I will try to shorten these entries :). Thanks again for visiting! If you have any comments or questions, please feel free to leave them on the blog or email me at bobsadviceforstocks@lycos.com. Please be sure to visit my podcast website at http://bobsadviceforstocks.podomatic.com where you can listen to me droning on and on :) about many of these same stocks!
Bob
Newer | Latest | Older


