Stock Picks Bob's Advice
Sunday, 8 October 2006
"Weekend Trading Portfolio Review" Meridian Bioscience (VIVO)

Hello Friends! Thanks so much for stopping by and visiting my blog, Stock Picks Bob's Advice! As always please remember that I am an amateur investor, so please remember to consult with your professional investment advisors prior to making any investment decisions based on information on this website.
Besides reviewing stock picks on this blog, and discussing some general portfolio management techniques that I employ, I also like to share with you my actual trading portfolio. These are stocks that I currently own and with which I really do employ these stock picking and buying and selling strategies. My goal is to review one position (of my current 11 positions) every two weeks. Normally, with a full portfolio of 25 positions, this would be about once/year. However, with only 11 holdings, I shall continue this process and currently at this rate will be reviewing these stocks about once every 6 months.
Two weeks ago I reviewed my Starbucks holding on this blog. Going alphabetically (through the stock symbols), I am now up to Meridian Bioscience (VIVO). Let's take another look at my own trading history with this investment and see if it still deserves a place on this blog!

Currently, I own 210 shares of Meridian Bioscienc (VIVO) in my Trading Account. These shares were purchased April 21, 2005, with a cost basis of $11.13/share. I should note that this was not the first time I have owned Meridian in this account. Back on April 22, 2004, I purchased 400 shares of Meridian but only managed to hang on to these shares for a bit under a month before incurring a more than 8% loss, and selling the entire lot of shares on May 17, 2004. When the stock came up on the screens a year later, I went ahead and purchased my current holding.
Meridian closed October 6, 2006, at $23.56, down $(.47) or (1.98)% on the day. Thus, I have a current unrealized gain of $12.43 or 111.7% on these shares. As my trading strategy dictates, I have been selling portions of my holdings of Meridian at targeted appreciation levels. I have sold shares 7/25/05, 9/1/05, 10/3/05, and 1/6/06 at the 30, 60, 90, and 120% appreciation targets. Thus, my next targeted sale on the upside would be at a 180% gain or as calculated: 2.80 x $11.13 = $31.16. On the downside, with my last sale at a 120% appreciation target, allowing for a 50% retracement to a 60% appreciation level, would give me a sale target of 1.6 x $11.13 = $17.81. If the stock should drop to this level, I would be selling all of my shares, as opposed to my 1/6th remaining shares sale at positive appreciation targets.
But let's take a closer look at the stock itself and see how things 'stack up'!
1. What exactly does this company do?
Looking at the Yahoo "Profile" on VIVO, we find that the company
"...operates as an integrated research, development, manufacturing, marketing, and sales organization in the field of life science. It develops, manufactures, and distributes diagnostic test kits primarily for respiratory, gastrointestinal, viral, and parasitic infectious diseases; and bulk antigens, antibodies, and reagents used by researchers and other diagnostic manufacturers, as well as provides contract manufacturing service of proteins and other biologicals for use by biopharmaceutical and biotechnology companies that are engaged in research for new drugs and vaccines."
2. Is there any recent news that may be affecting the stock price?
Looking through the Headlines section on Yahoo, the only relatively recent news that I think is significant was the story on September 14, 2006, that MRO Software (MRO), which apparently was being acquired by IBM Corp., will be replaced in the Standard & Poor's SmallCap 600 index by Meridian (VIVO). For the S&P index, their SmallCap range is between $300 million and $2 billion. Since there are many investors and institutions that choose to make investments in vehicles that mirror these indices, this is a bullish news story for the company.
3. How did the company do in the most recent quarter?
On July 20, 2006, Meridian reported 3rd quarter 2006 results. Net sales for the quarter came in at $26.6 million, up 5% from $25.4 million in the same quarter the prior year. Net earnings were $4.86 million, up 39% from $3.50 million the prior year. Earnings per diluted share worked out to $.18/share, a 29% increase over the $.14/share reported the same quarter last year. In addition, in the announcement, they declared a regular quarterly dividend of $.115/share, with a $.46/share indicated annual rate, 44% higher than the regular quarterly rate of 2005. And also 'reaffirmed its recently increased guidance of net sales beteween $106 and $109 million (previously $103 to $107 million) and per share-diluted earnings between $.63 and $.66 (previously $.60 to $.63) for the fiscal year ending September 30, 2006.'
As good as this report sounds, the 'street' was a bit disappointed with the revenue report. As reported, the company did meet or exceed earnings results anticipated by analysts, they fell short of revenue estimates of $27.9 million and $26.8 million. Otherwise, the report was reasonably good especially with the continuing 'double-digit sales and earnings growth for fiscal 2007.'
4. What about longer-term financial results?
Reviewing the Morningstar.com "5-Yr Restated" financials on VIVO, we can see that the revenue growth has been very steady, increasing from $57 million in 2001 to $93 million in 2005 and $105 million in the Trailing Twelve Months (TTM).
Earnings, which were at a loss of $(.47)/share in 2001, turned profitable at $.23/share in 2002, and have increased steadily since to $.52/share in 2005 and $.66/share in the TTM. The company has been a steady dividend payer and has been raising its dividend each year (another plus for many investors.) The company paid $.17/share in 2001, $.31/share in 2005, and $.39/share in the TTM. There has been a small increase in the number of shares outstanding with 22 million reported in 2001 and 23 million in 2005 but 26 million reported in the TTM.
Free cash flow has been positive and growing. $11 million in 2003 increasing to $16 million in 2005 and $18 million in the trailing twelve months.
The balance sheet is gorgeous. The company is reported by Morningstar.com to have $35.7 million in cash, more than enough to pay off the current liabilities more than twice over and actually enough to pay off both the current and long-term liabilities which total togeter $22.7 million. The current ratio, when we add the $39.3 million of other current assets to the cash yields a ratio of 4.52. Generally, ratios of 2 or higher are considered 'healthy' at least from this particular perspective.
All-in-all, the Morningstar.com report is a very pretty picture of a small, steadily growing company.
5. What do the valuation numbers on this stock look like?
Looking at the Yahoo "Key Statistics" on VIVO we find that this company is a small mid-cap stock with a market capitalization of $615.52 million. The trailing p/e is moderately rich at 35.76, and the forward p/e is a bit better (fye 30-Sep-07) estimated at 28.05. No PEG is reported.
Examining the Fidelity.com eresearch website, we find that Meridian is in the "Diagnostic Substances" industrial group. Within this group, VIVO is reasonably priced with a Price/Sales ratio of 2.2. Topping the group is Human Genome Sciences (HGSI) with a ratio of 55.3, followed by ADEZA (ADZA) at 6.7, Myriad Genetics (MYGN) with a ratio of 4, then Meridian (VIVO) at 2.2, DIGENE (DIGE) at 1.5, and Dade Behring (DADE) at 0.9.
In terms of profitability, VIVO has the highest return on equity (ROE) of the group at 19.7%. This is followed by Dade Behring at 17%, ADEZA at 9.9%, DIGENE at 5.9%, Myriad Genetics at (17.1)%, and Human Genome Sciences at (63.3)%.
Finishing with Yahoo, we can see that there are only 26.12 million shares outstanding with 21.51 million that float. There are quite a few short-sellers on this stock with 1.24 million shares out short as of 9/12/06, representing 5.7% of the float or 8.9 trading days of volume. Using my own 3 day rule on the short ratio, this is triple that level, and if the company has any positive reports, there may well be a squeeze of the shorts pushing the shares higher. However, if the shorts are seeing something I don't....well that would mean they could be right! In any case, these 1.24 million shares that are already sold will need to be repurchased in the future and can only help prop up the stock price when that is done.
As noted, the company also pays a nice dividend with a forward annual rate of $.46/share yielding 2%. The company last split its stock with a 3:2 split on September 6, 2005.
6. What does the chart look like?
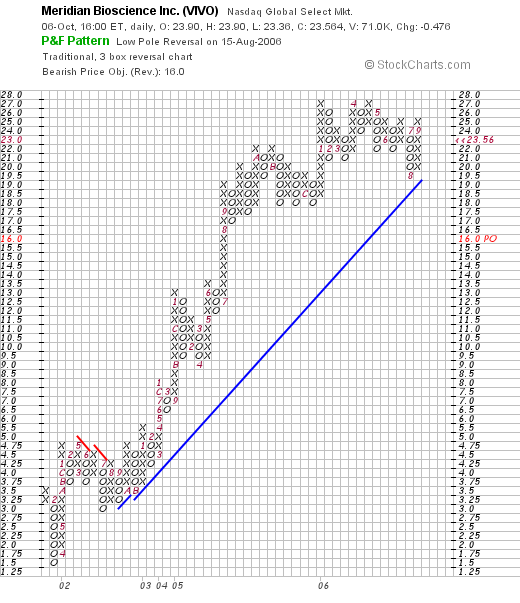
If we look at the Meridian Bioscience (VIVO) "Point & Figure" chart from StockCharts.com, we can see that this company has had a steady ride from $1.50 in February, 2001, when it last showed significant weakness, to its peak at $27 which it has hit three times in January, 2006, as well as in April, 2006. The stock has actually been trading sideways this year, but still appears to be above its support level. It does not appear over-extended to me, but I would like to see this stock, which is trading just under $24, to get through that $27 level to feel confident that it is on the upswing once again.
7. Summary: What do I think about this stock?
Let's take a look at a few things that I have commented on above. First of all, I own this stock so that is my own bias. However, the news of its inclusion in the SmallCap 600 is encouraging. The latest quarter was a tad soft on revenue growth with strong earnings and an increased dividend report. In addition, guidance appears to be reasonably bullish. I think the stock, if indeed we get a good next quarter, will resume its upward move. However, until then, we may have to wait while it 'treads water' so to speak.
The Morningstar report was very nice with a consistent growth in revenue, earnings and free cash flow. As "icing on the cake" the company pays a small dividend that it is regularly increasing. The balance sheet is solid. Valuation-wise, the p/e is a bit rich in the mid 30's. However, with the 30% plus earnings growth reported, even though we don't have a PEG, at least from this current quarter, I would expect that a PEG wouldn't be much above 1.5 if at all. But THAT is just my guess. Finally the chart looks nice. I think all it will take is another nice earnings report, and the stock price moves higher with the short-sellers scrambling to cover their bets that the stock price declines. Anyway, that's my view!
Thanks so much for stopping by and visiting! If you have any comments or questions, please feel free to leave them on the blog or email me at bobsadviceforstocks@lycos.com. When you get a chance, drop by and visit my Stock Picks Podcast Site where you can hear me talk about many of the same stocks I write about here on this website!
Bob
Saturday, 7 October 2006
"Looking Back One Year" A review of stock picks from the week of June 6, 2005

Hello Friends! Thanks so much for stopping by and visiting my blog, Stock Picks Bob's Advice. As always, please remember that I am an amateur investor, so please remember to consult with your professional investment advisors prior to making any investment decisions based on information on this website. I also always look forward to any of your comments, suggestions, or questions, and you can reach me at bobsadviceforstocks@lycos.com if you are so motivated!
One of my weekend tasks for the blog is to do a retrospective analysis of past stock selections. I have been doing this a week at a time, assuming that an equal dollar amount might have been purchased in each of the stocks discussed on the blog that particular week and that I employed a "buy and hold" strategy on these purchases. In reality, I suggest and employ a disciplined portfolio management system that involves selling losing stocks quickly and completely, and selling gaining stocks slowly and partially. For the sake of this review, I assume that stocks were purchased and still held at this time.
 On June 7, 2005, I posted Harman International (HAR) on Stock Picks when it was trading at $94.77. HAR closed at $86.32 on October 6, 2006, for a loss of $(8.45) or (8.9)% since posting.
 On August 15, 2006, Harman reported 4th quarter 2006 results. Revenue for the quarter came in at $859.1 million, up 6% from last year's $808 million. Analysts, according to Thomson Financial, had expected revenue of $873.4 million. The company earned $64.8 million or $.96/share, down from last year's $70.2 million or $1.01/share. After removing "restructuring charges and senior debt buybacks", the company earned $1.09/share, ahead of expected $1.07/share excluding charges. In that department, the company exceeded expectations. However, looking ahead, the company forecast $4.35/share in 2007, which is lower than the analysts' $4.46/share expected. All-in-all, a bit of a disappointing report.
 On June 8, 2005, I posted Balchem (BCP) on Stock Picks at a price of $29.50/share. On January 23, 2006, Balchem had a 3:2 stock split, making my effective stock pick price actually $19.67. BCP closed at $19.80 on October 6, 2006, for a gain of $.13 or .7% since posting.
 On August 1, 2006, BCP announced 2nd quarter 2006 results. For the three months ended June 30, 2006, net sales increased 28.8% to $25.1 million from $19.5 million in the same quarter last year. Net earnings increased 11.9% to $3.06 million, from $2.73 million in the same quarter last year. On a per diluted share basis, net earnings increased 8.7% to $.25/share, up from $.23/share.
 Finally, on June 20, 2005, I posted Boston Beer (SAM) on Stock Picks Bob's Advice when the stock was trading at $23.08. Boston Beer closed at $33.24 on October 6, 2006, for a gain of $10.16 or 44% since posting.
On August 8, 2006, Boston Beer announced 2nd quarter 2006 results. For the quarter ended July 1, 2006, revenue climbed 28% to $87.6 million from $68.5 million last year. Profit came in at $8 million or $.56/share, up 60% from $.35/share last year. This, according to Thomson Financial, exceeded analysts' expectations of $.38/share. The company also raised guidance for 2006 full year to $1.16 to $1.31, (excluding stock option expenses of $.06 to $.11), this was up from prior guidance between $1.10 to $1.18/share. Thus, this was a great earnings report, with strongly improving revenue and earnings, and also exceeding expectations and raising guidance!
So how did I do with these three stocks? Well, I had one small loss, one break-even, and one strong gain for an average performance of a gain of 11.9% for this week a bit over a year ago!
Thanks so much for stopping by and visiting! If you have any comments or questions, please feel free to drop me a line at bobsadviceforstocks@lycos.com. I cannot promise to answer every email I receive, but I read all of them and share many of the comments here and on my podcast. Speaking of which, be sure and visit my Stock Picks Podcast Site, where I also discuss many of these same stocks in an audio show.
Bob
Posted by bobsadviceforstocks at 10:15 PM CDT
|
Post Comment |
Permalink
Updated: Saturday, 7 October 2006 10:16 PM CDT
Guess (GES) October 7, 2006
CLICK HERE FOR THE PODCAST ON THIS ENTRY!
Hello Friends! Thanks so much for stopping by and visiting my blog, Stock Picks Bob's Advice. As always, please remember that I am an amateur investor, so please remember to consult with your professional investment advisors prior to making any investment decisions based on information on this website.
 Two days ago, I promised you that I would write something about Guess (GES), and I wanted to get back to that stock and complete my review. GES closed yesterday at $53.89, down $(.01) or (.02)% on the day. I do not own any shares of Guess nor do I have any options on this stock. Even though yesterday the stock did not move strongly higher, on the previous day's trading, Guess had made a very strong move higher, making the list of top gainers on the NYSE. Let's review some of the things that led me to pick this stock for the blog!
1. What exactly does this company do?
According to the Yahoo "Profile" on Guess (GES), the company
"...engages in the design, marketing, distribution, and licensing of lifestyle collections of casual apparel and accessories for men, women, and children. Its product lines comprise collections of denim and cotton clothing, including jeans, pants, overalls, skirts, dresses, shorts, blouses, shirts, jackets, and knitwear. The company also grants licenses to manufacture and distribute a range of products, including eyewear, watches, handbags, footwear, kids’ and infants’ apparel, leather apparel, fragrance, jewelry, and other fashion accessories."
2. Was there any recent news to explain the stock's move higher?
 As reported on Thursday, October 5, 2006, Guess reported their September 'same-store sales' results. This figure, as I have emphasized throughout this blog, is one of the most important factors, imho, determining the success or failure of any retail venture. If you are in the dark on this, you might want to read this Motley Fool explanation by Bob Fredeen. In any case, Guess announced that September same-store sales increased by 11.3%. Not only is this a very strong retail result, but two other factors should be considered. First, the news exceeded expectations, meaning that this good news exceeded the 4.3% figure expected by those who follow this company. Second point, the company related that same store sales in the third quarter increased 8.6%. Thus, the September figure represented an acceleration of same-store sales growth compared to the other months in this quarter. I guess the only thing that the company didn't do was to suggest that future same-store sales growth were also expected to increase at this rate.
I found another Motley Fool article that mentioned GES that pointed out another critical point in picking stocks. The article is titled "Misinterpreting the Mall", and Seth Jayson points out that just because your walk through the mall shows that folks seem to be buying a lot of stuff at store "A", but not at store "B" that this 'research' may encourage you to go out and buy stock in that mall store you saw full of customers, you might need to do a bit more research than that! This is commentary on what the now famous Peter Lynch, the former Fidelity Magellan manager whose famous comment,
"If you stay half-alert, you can pick the spectacular performers right from your place of business or out of the neighborhood shopping mall, and long before Wall Street discovers them."
has been mis-applied by too many investors for too long. What you see in the mall may be a good start, but the same-store sales figures are hard to argue with!
3. How did this company do in the latest quarter?
On August 2, 2006, Guess (GES) reported 2nd quarter 2006 results. For the quarter ended July 1, 2006, the company reported revenue of $231.0 million, a 29.6% increase over $178.2 million in the same quarter last year.
Comparable store sales during the quarter increased 17.4%. Net earnings for the quarter climbed 230% to $13.7 million from net earnings of $4.2 million the prior year. Diluted earnings per share increased 233.3% to $.30/share vs. $.09/share in the same quarter last year. The company went ahead and raised guidance for the third quarter for revenue growth to 'slightly more than 20%'. The company also raised guidance for earnings with an improvement of $1.5 million to $2.0 million or $.03-$.04/share over prior guidance.
I comment a lot about my 'trifecta-plus' in earnings announcements and this company did just this! In other words, they managed to announce strong revenue and earnings growth, raised guidance and they also beat expectations handily. As reported elsewhere, the company reported earnings per share of $.30. Analysts had been expecting $.22/share. Revenue came in at $231 million; analysts at Thomson First Call expected $219.3 million. This was a very strong quarterly report!
4. How about longer-term financial results?
Let's take a look at the Morningstar.com "5-Yr Restated" financials on Guess (GES). First of all, the company did have a week 2001/2002 sequence with revenue dipping from $678 to $583 million, and earnings dropping from $.14/share to a loss of $(.26)/share. However, since 2002, revenue has climbed steadily from $583 million to $936 million in 2005 and $1.03 billion in the trailing twelve months (TTM). Earnings have improved from that loss of $(.26) in 2002 to $1.31/share in 2005 and $1.67/share in the TTM. The number of shares outstanding has been stable with 45 million in 2001, dipping to 44 million in 2005 and climbing to only 46 million in the TTM. No dividends are paid.
Free cash flow the past several years has been positive and growing with $44 million in 2003, $47 million in 2004, $95 million in 2005 and $134 million in the TTM.
The balance sheet looks solid with $197.3 million in cash and $236.5 million in other current assets. This total of $433.8 million, easily covers the $225.1 million in current liabilities yielding a healthy 'current ratio' of 1.93.
5. What about some valuation numbers for this stock?
Reviewing the Yahoo "Key Statistics" on Guess, we can see that this company is a mid cap stock with a market capitalization of only $2.46 billion. The company has a moderately rich p/e of 32.52, and a more reasonable forward p/e estimated (fye 31-Dec-07) of 23.33. The PEG works out to an acceptable 1.26.
Looking at the Fidelity.com 'eresearch' website, we can see that Guess (GES) is in the "Textile-Apparel Clothing" industrial group and is moderately priced with a Price/Sales ratio of 0.6. Topping this group is BEBE Stores with a Price/Sales ratio of 1.7. This is followed by both Guess and VF Corp (VFC) at 0.6, Columbia Sportswear (COLM) at 0.3, Hot Topic (HOTT) at 0.1 and Quiksilver (ZQK) at 0.1.
Checking the Return on Equity (ROE) as a measure of 'profitability', we can see that Guess (GES) leads this group with a ROE of 25.4%. GES is followed by BEBE at 19.5%, VF Corp at 18.5%, Columbia Sportswear at 17.1%, Quiksilver at 7.9% and Hot Topic at 7%.
Returning to Yahoo, Guess has 45.62 million shares outstanding with 21.03 million that float. As of 9/12/06 there were 4.44 million shares out short, representing 18.50% of the float or 3.9 trading days of volume (the short ratio). Using my own '3 day rule' on short ratios, this is a bit high and may be a bullish influence on stock performance. No dividend is paid and no stock splits are reported on Yahoo.
6. What does the chart look like?
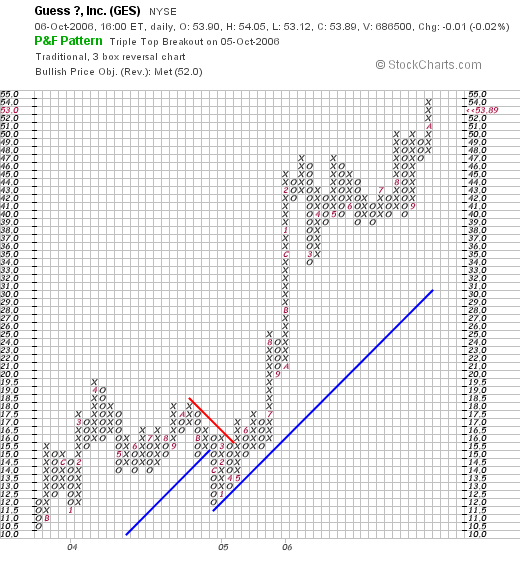
Reviewing a "Point & Figure" chart on Guess (GES) from StockCharts.com, we can see what appears to me to be a very strong performance the past few years. The stock price appreciated from $10.50 in late 2003, consolidating between that level and $19.50 until May, 2005, when the price broke out through resistance at $16, and moved strongly higher to its current level. Since January, 2005, the stock price has more than quadrupled to the recent $53.89 level.
7. Summary: What do I think about this stock?
Let's review some of the things that I have pointed out in the above discussion. First of all, the stock made a strong move higher on strong same-store sales results. This report beat expectations and demonstrated short-term acceleration in comparative sales results. The latest quarter earnings report was very nice with the company reporting strong revenue and extremely strong (more than 200%) increases in both earnings and earnings/share. This exceeded expectations as well and the company raised guidance. The Morningstar.com report looked nice with at least 4 years of steady revenue and earnings growth, steady shares outstanding and increasing free cash flow. The balance sheet appears solid.
Valuation-wise, the p/e is a bit rich in the 30's but the PEG is reasonable, the Price/Sales ratio is near the mean of its group, and the company leads the pack on Return on Equity. This is a company with relatively few shares floating and even some short-sellers who may have to cover (?) if the stock moves higher. No dividend is reported. Finally, the chart looks quite strong, if not a tad over-extended. All-in-all I like this stock for all of these reasons. I am not buying any shares as I do not have a 'signal' from my own portfolio but this is the kind of company I want to have in my 'vocabulary' of investable stocks!
Thanks so much for stopping by and visiting! If you have any comments or questions, please feel free to leave them right on the blog or email me at bobsadviceforstocks@lycos.com! Also, be sure and visit my podcast site where I discuss many of the same stocks I write about here on Bob's Advice!
Bob
Posted by bobsadviceforstocks at 11:06 AM CDT
|
Post Comment |
Permalink
Updated: Sunday, 8 October 2006 3:22 PM CDT
Thursday, 5 October 2006
Guess? (GES) and I answer a letter from a reader!
CLICK HERE FOR MY PODCAST ON THIS ENTRY!
Hello Friends! Thanks so much for stopping by and visiting my blog, Stock Picks Bob's Advice! As always, please remember that I am an amateur investor, so please remember to consult with your professional investment advisors prior to making any investment decisions based on information on this website.
 Before I get to my entry on Guess?, I wanted to share with you all a very nice email I received from Alonso R. who wrote:
"
Dear Bob,
I am writing you from Peru. I have been investing in the US stock market since last July and somehow I came across your podcast a couple of months ago. Personally, I believe it is great, thank you! I enjoy very much listening to it on my way back home after work and learning your methodology for stock screening and evaluation. I believe your approach is very straight forward and I find it extremely simple and helpful.
To this point I have not invested in any of the stocks you have recently analyzed, but I am planning of personally checking on some of them and maybe buy a couple os stocks, hovever I have been postponing it for for some weeks.
I know you are a big Morningstar fan and so I am, however, lately I see that the market is not behaving in the direction that Morningstar thinks. Any thoughts on that?
All the best to you and congratulations on the great work.
Best regards
Alonso R"
Well, Alonso, as I wrote back, I am very appreciative of your email and your comments regarding my podcast which I use to comment on many of the same stocks as my blog.
You have actually brought up two subjects: my stock picking, and my thoughts on the stock market in general vis a vis the Morningstar opinion on the market direction.
First of all, I think you are pretty familiar with my stock picking strategy. There may very well be many stock picking approaches that are superior to my approach; I would love to hear about your experience with the stocks I mention as compared to your experience with stocks that you choose with other techniques.
One of my portfolio strategies, however, is to allow my own portfolio to determine my own response to the stock market. I prefer not to anticipate or rely on my own deduction in this regards. I recall listening to William O'Neil, the publisher of the Investors Business Daily discuss his CANSLIM approach to investing. If you are not familiar with his strategy, you may wish to read his classic book, "How to Make Money in Stocks".
O'Neil astutely pointed out the importance of the "M" in CANSLIM, meaning the "Market". A particular comment that he made really was significant to me...he wrote about watching the behavior of the stocks you own. That when they start hitting sale points on bad news, it may well mean that the market itself is becoming weak. He emphasized the importance of keeping your losses small, and discussed selling stocks after an initial purchase at an 8% loss limit.
O'Neil has a different strategy on gaining stocks. I do not wish to speak for him, but he has certain sale points when stocks break down technically-speaking. He believes in adding to stocks, as I recall, that are climbing.
Personally, I listen and observe my own portfolio very closely. I also sell stocks after an initial purchase if they decline 8%. I call this 'selling my losing stocks quickly and completely.' What I have added is my own strategy for dealing with gaining stocks---selling my gaining stocks slowly and partially at targeted appreciation points. At this time, I have started selling 1/6th of my remaining shares at 30, 60, 90, and 120% points, then incrreasing by 60%: 180, 240, 300 and 360%; then by 90% intervals: 450, 540, 630, 720%....etc. In addition, if a stock I own retreats to 50% of its highest appreciation sale point, then I sell the entire position. For example, if I had last sold a stock...1/6th of my shares....at a 120% appreciation point, then, unless significant fundamental news was announced, I would sell all of my remaining shares if the stock price retreated to a 60% appreciation level from my purchase.
Finally, I use my sales as a signal....that is if a stock is sold on "bad news" either fundamental or technical, that is if something negative is announced or it hits a sale point on the downside, I use this as a signal that the market is not healthy and I do not reinvest the proceeds, instead I 'sit on my hands.' My only exception is if I am at my minimum portfolio level, which for me is 6 positions. In that case I would replace that stock with a new stock that fit my purchase criteria.
If selling a stock on a decline is 'bad news', then the converse may also be helpful. That is, I use a sale at an appreciation target as 'good news', giving me permission to add a new position (unless I am at my maximum portfolio size which is at 25 positions.)
Thus, I do not spend time guessing the direction of the market. I let my portfolio dictate my bias.
I really intended to write up Guess (GES) which made a nice move to the upside, but it is getting late and I shall save that post for another day...perhaps this weekend I can write it up. For the record, GES closed at $53.90, up $3.77 or 7.52% on the day today. The stock moved higher on strong same store sales results for September.
Thanks again for stopping by and visiting! If you have any comments or questions, please feel to drop me a line at bobsadviceforstocks@lycos.com and be sure to visit my podcast site.
Bob
Posted by bobsadviceforstocks at 10:17 PM CDT
|
Post Comment |
Permalink
Updated: Thursday, 5 October 2006 11:21 PM CDT
Saturday, 30 September 2006
"Looking Back One Year" A review of stock picks from the week of May 30, 2005
Hello Friends! Thanks so much for stopping by and visiting my blog, Stock Picks Bob's Advice! As always, please remember to consult with your professional investment advisors prior to making any investment decisions based on information on this website.
It is hard for me to believe that it is the weekend once again. Sometimes when you are busy, the days really fly by. Anyhow, without a market to be checking, the weekend offers me a chance to review past selections to find out how they are turning out and to help me refine my own stock-picking technique.
This review assumes a "buy and hold" strategy. In practice I employ a portfolio management strategy that actively manages my holding, selling losing stocks quickly after an initial purchase and gaining stocks slowly at set appreciation targets. However, for the sake of simplicity, I have been assuming that equal dollar amounts of each stock pick was purchased for the week that I am reviewing. When looking at the 'average performance' I have been average all of the individual performances for an arithmetic mean. Occasionally I own or have owned stocks discussed. I generally don't indicate this on reviews, but in this case, I currently still own some shares of COH, otherwise, I do not own the stocks discussed in this entry.
 On May 31, 2005, I posted American Vanguard (AVD) on Stock Picks Bob's Advice when it was trading at $18.00/share. On April 18, 2006, AVD had a 4:3 stock split so my effective pick price works out to $13.50. AVD closed at $14.00 on September 29, 2006, for a gain of $.50/share since the stock was selected or 3.7% since posting.
American Vanguard announced on September 28, 2006, that even though net sales should be rising in 2006, lower net income should result due to "increased opereating expenses and higher interest and tax rates." Just as 'raising guidance' is a big plus in my book, stocks that do the opposite, lowering guidance, is quite a damper on future price performance in my experience. Normally, I would have given this stock a 'thumbs-up' because on August 7, 2006, AVD reported 2nd quarter 2006 results. Sales for the quarter ended June 30, 2006, climbed 14% to $42.7 million, and net income jumped 21% to $3.3 million while earnings per share were up at $.12/share from $.11 in the second quarter of 2005. But with the lowered guidance, the stock does not deserve a 'thumbs-up'!
 On June 1, 2005, I 'revisited' Coach (COH) and picked it again for the blog when it was trading at $30.67/share. COH closed at $34.40 on September 29, 2006, for a gain of $3.73 or 12.2% since posting.
On August 1, 2006, Coach reported 4th quarter 2006 results. The company reported that net sales grew 23% to $514 million. Net income increased 31% to $118 million or $.31/diluted share, up from $90 million or $.23/diluted share in the same period a year earlier. The company beat expectations of $.29/share for the quarter. The company also went ahead and raised guidance for fiscal 2007 with sales now expected at $2.5 billion, up about 19% from the 2006 year. Earnings are now forecast to rise to at least $1.55, up 22% over the year earlier and ahead of the current analysts expectations of $1.53/share. Thus, this is my 'trifecta-plus' in a quarterly report, which means that the company did everything right: reported increased revenue, increased earnings, beat expectations and raised guidance. My kind of earnings report!
 Finally, on June 2, 2005, I 'revisited' Abercrombie & Fitch (ANF) on Stock Picks Bob's Advice when it was trading at $65.12/share. ANF closed at $69.48/share on September 29, 2006, for a gain of $4.36 or 6.7% since posting.
On August 15, 2006, Abercrombie & Fitch reported 2nd quarter results. For the quarter ended July 29, 2006, sales climbed 15% to $658.6 million from $571.6 million. Profits came in at $65.7 million or $.72/share, up from $57.4 million or $.63/share in the same quarter last year. This came in pretty much in line with expectations which were for earnings of $.71/share on sales of $659 million. The stock moved higher on the announcement as the company guided second half expectations higher with earnings of $3.15 to $3.20/share in the second half of fiscal 2006 with full year earnings of $4.49 to $4.54/share. Analysts had been expecting full year earnings of $4.39/share.
So how did I do during that week picking stocks? Well, I guess you could say reasonably well with all three stocks moving higher and an average gain of 7.53% since being "picked" on the blog.
Thanks so much for visiting! Please note the new "Pico Search" feature on the blog which will allow you to search the many (over 1,000 entries!) on this website where I discuss many stocks of current interest. If you have any comments or questions, please feel free to drop me a line at bobsadviceforstocks@lycos.com and be sure to visit my Stock Picks Podcast Site.
Bob
Friday, 29 September 2006
"Revisiting a Stock Pick" Moody's (MCO)
CLICK HERE FOR MY STOCK PICKS PODCAST ENTRY ON MOODY'S
Hello Friends! Thanks so much for stopping by and visiting my blog, Stock Picks Bob's Advice! As always, please remember that I am an amateur investor, so please consult with your professional investment advisors prior to making any investment decisions based on information on this website.
Before I get to my main entry, I wanted to share with you a very nice email that I received the other day from Robert D. who wrote:
"Bob, I love your site, your up-to-date research is very helpful, and I learned a lot about a lot of companies.
I'm not sure if you have it (maybe I did not see it), but it would be very useful as an organizational too, to include either a "search" feature on your site, where we can find your research on a given stock (since you have done quite a few now!), or a list of the companies covered with links to the appropriate research page.
I know I have a hard time finding old articles your wrote about a specific company, just thought it might help!
Keep up the great work, and best of luck in the market!"
Robert, I believe I have fixed the problem. I loaded up a "PICO SEARCH" which, although I am not sure all of my readers are familiar with this, should be able to search through the blog to find entries that you may be looking for. Give it a try and let me know what you think!
 I was looking through the list of top % gainers on the NYSE today and came across Moody's, a stock that I first discussed on Stock Picks Bob's Advice on August 22, 2005, a bit more than a year ago when it was trading at $49.37. I still do not own any shares of Moody's (MCO) nor do I have any options. Moody's closed at $65.38 today, up $2.41 or 3.83% on the day. The stock is higher by $16.01 or 32.4% since I posted it about 13 months ago here on the blog.
Let's take another look at this company and I shall share with you my thinking about why the stock is still worthy of consideration.
1. What exactly does this company do?
According to the Yahoo "Profile" on Moody's, the company
"...through its subsidiaries, provides credit ratings, and research and analysis services for capital markets worldwide. The company also offers credit training services, credit risk assessment products and services, and credit processing software for banks, corporations, and investors."
2. Was there any news to explain today's move higher?
Looking through the Yahoo "Headlines" on Moody's, I found a story that suggested that new legislation signed into law today by President Bush, gave authority to the SEC for new credit rating agencies. Apparently, they must be designated as "nationally recognized" agencies, giving Moody's, Standard and Poor's and the Fitch Ratings an edge over new credit rating firms. In any case, it appears the 'street' liked this development and the stock moved higher.
3. How did the company do in the latest reported quarter?
On August 2, 2006, Moody's reported 2nd quarter 2006 results. for the quarter ended June 30, 2006, the company reported revenue of $511.4 million, a 14% increase over the prior year's $446.8 million. Earnings came in at $172.1 million or $.59/share, up from $145.4 million or $.47/share in the prior year same period. According to the same report, analysts at Thomson First Call had expected revenue of $485.8 million and earnings of $.56/share. Thus, the company grew its revenue and earnings, and also exceeded expectations on both revenue and earnings. The company finished off this 'trifecta-plus' earnings report by raising guidance for its earlier profit forecast for 2006.
4. How about longer-term financial results?
If we review the Morningstar.com "5-Yr Restated" financials on Moody's (MCO), we can see that revenue has steadily increased from $.8 billion in 2001 to $1.7 billion in 2005 and $1.8 billion in the trailing twelve months (TTM).
During this same period, earnings have steadily increased (without a miss!) from $.66/share in 2001 to $1.84/share in 2005 and $2.05/share in the TTM.
An added 'bonus' is the fact that MCO does pay a dividend, which while unchanged between 2001 and 2003 at $.09/share, was raised to $.15/share in 2004, $.18/share in 2005 and has been $.25/share in the TTM. While not a 'requirement' of mine on this blog, the presence of a dividend that has also been steadily increasing is an added 'plus' to any stock evaluation.
While I like to see a steady or only a slowly-growing number of shares outstanding, it is rare to see a company that has been steadily decreasing its outstanding shares. Moody's has accomplished this with 314 million shares outstanding in 2001, steadily declining to 298 million in 2005 and 282 million in the TTM. This decrease in the number of shares has occurred while the company has more than doubled its revenue and tripled its earnings!
Free cash flow has been strong recently with $449 million reported in 2003, increasing to $677 million in 2005 and $652 million in the trailing twelve months.
The balance sheet, as reported on Morningstar.com appears satisfactory with $230.3 million in cash and $449.5 million in other current assets. When this total of $679.8 million in current assets is compared to the $527.1 million in current liabilities, we are left with a current ratio of 1.29. This appears adequate, especially with the strong free cash flow, but in general, ratios closer to 2.0 or higher are preferable to lower ratios closer to 1.0.
5. What about some valuation numbers for this company?
If we review the Yahoo "Key Statistics" on Moody's, we find that the market cap is a large cap $18.43 billion. The trailing p/e is a moderately rich 31.94 with a forward p/e (fye 31-Dec-07) estimated at 27.59. The PEG also suggests a rich valuation at 1.97.
Reviewing the Fidelity.com eResearch website on Moody's, we find that this stock is in the "Credit Services" industrial group. Moody's is relatively reasonably priced (imho) when examined from the perspective of the Price/Sales ratio. Leading this group is CapitalSource (CSE) with a ratio of 4, following CSE is Moody's (MCO) at 1.9, then Alliance Data Systems (ADS) at 0.9, American Express (AXP) at 0.8, Fannie Mae (FNM) at 0.7, and Capital One Financial (COF) at 0.3.
Comparing relative profitability, through the perspective of the return on equity (ROE), Moody's leads the pack with a whopping return of 203.3%. Following Moody's is Fannie Mae at 43.7%, American Express at 33.4%, Alliance Data Systems at 17.4%, Capital One at 15.7%, and CapitalSource at 14.2%.
Returning to Yahoo for a few more numbers, we find that there are 281.90 million shares outstanding and 281.62 million that float. Of these, 4.85 million (as of 9/12/06, down from 4.91 million the prior month) are out short, representing 1.70% of the float. This represents 4.6 trading days of volume (the short ratio). Using my arbitrary 3 day rule of short interest, this appears somewhat significant, meaning that I believe that this short interest may start creating an upward pressure (or short squeeze) on the stock price if there is continued release of 'good news' from the company.
As I noted above, the company pays a small dividend estimated at $.28/share in the upcoming 12 months which would represent a yield of 0.4%. The last stock split was as recently as May 19, 2005, when the stock split 2:1.
6. What does the chart look like?
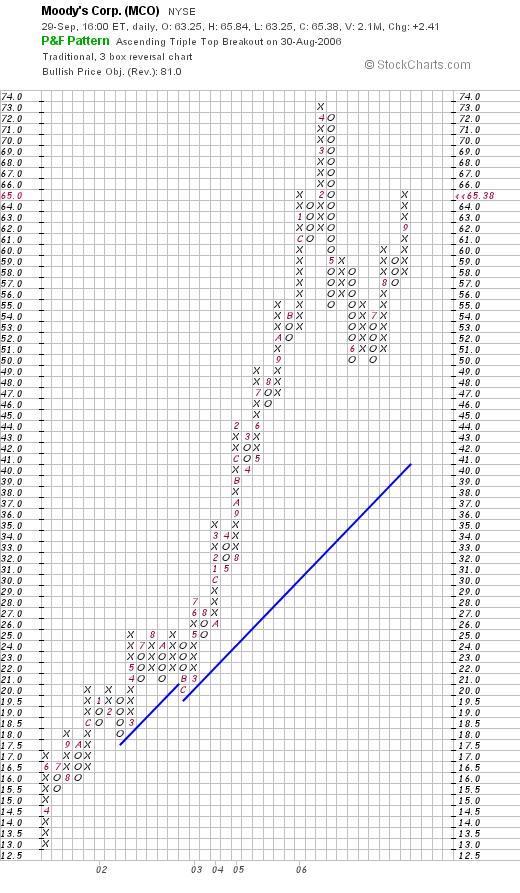
If we examine the "Point & Figure" chart on Moody's from StockCharts.com, we can see that the stock moved steadily higher from a low of $13/share in March, 2001, to a high of $73/share in April, 2006. The stock has pulled back rather sharply this year to a low (a double-bottom as seen on the chart) of $50/share. The stock is now apparently moving higher again, above its support line (the blue 45 degree upward line). The chart looks pretty strong to me!
7. Summary: What do I think about this stock?
To summarize, the stock Moody's, the well-known rating agency, made a nice move higher on some additional laws that will insulate them from competition. This would be a reinforcement of the 'moat' concept, so well explained by the Morningstar analysts and advanced by Warren Buffett.
Their latest quarterly report was superb imho, with strong earnings and revenue growth. The company added the icing to the announcement by beating expectations on both revenue and earnings and by raising guidance. This was my favorite kind of earnings report!
Longer-term, the Morningstar.com report was gorgeous. Several points on that report that caught my attention were the consistency of the revenue and earnings growth, the presence of a dividend, and the recent steady increase in the dividend payment. Topping it off was the steady decrease in the outstanding shares which by itself adds value to an existing shareholder!
Free cash flow was solidly positive. On a slightly negative (but not critical imho) note, the company had a relatively low current ratio with a significant current liabilities account. I can overlook this fact in light of the strong free cash flow reported.
Other parameters included the Price/Sales ratio which was fairly average for the group and the very strong return on equities figure that outpaced the other companies in the same industrial group. The p/e, however, was a bit rich and the PEG wasn't any better being just under 2.0. Finally, the stock did have a significant number of short-sellers, which could be considered a 'bullish' statistic. Looking at the graph, the company has had a very steady price appreciation, which, it appears, only suffered by getting ahead of itself earlier this year. The stock price appears to be appreciating once again.
Anyhow, if I were to be buying shares this might be the kind of stock I would be buying. I prefer to invest in more mid cap sized companies just from the perspective of the potential growth, which I believe can be more dynamic for the investor.
Thanks again for stopping by and visiting! If you have any additional comments or questions, please feel free to email me at bobsadviceforstocks@lycos.com. Please check out that Pico Search that I have now placed along the left side of the blog which can locate past discussions on this growing, and difficult to manage website! While you are at it, please be sure to drop by and visit my Stock Picks Bob's Advice podcast website, where I get the opportunity of discussing many of the same stocks that I write about on the blog!
Bob
Posted by bobsadviceforstocks at 5:17 PM CDT
|
Post Comment |
Permalink
Updated: Saturday, 30 September 2006 11:26 PM CDT
Monday, 25 September 2006
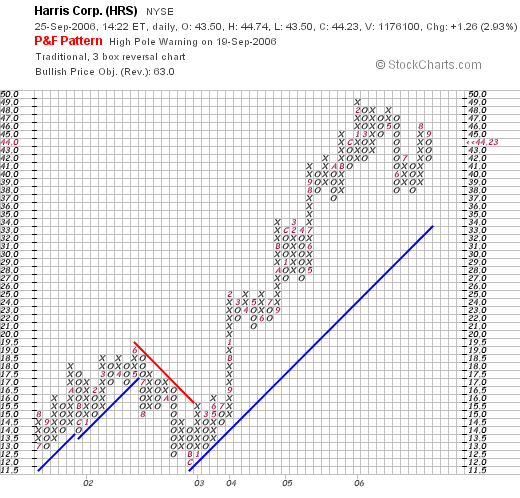
Harris Corporation (HRS)
Hello Friends! Thanks so much for stopping by and visiting my blog, Stock Picks Bob's Advice! As always, please remember that I am an amateur investor, so please remember to consult with your professional investment advisors prior to making any investment decisions based on information on this website.
 I would like to try to briefly present a stock this afternoon that made the list of top % gainers on the NYSE. As I write, Harris Corp. (HRS), is trading at $44.25, up $1.28 or 2.98% on the day. I do not own any shares or have any options on this company. I do think it deserves a place on this blog!
According to the Yahoo "Profile" on Harris, the company "...through its subsidiaries, provides communications products, systems, and services to government and commercial customers. It operates in four segments: Government Communications Systems, RF Communications, Microwave Communications, and Broadcast Communications."

What drove the stock higher today was an announcement that due to a positive settlement between Harris and the IRS, the company was raising guidance by $.08 for the year ending in June, 2007, from $2.60 to $2.70 to $2.65 to $2.75/share.
On July 26, 2006, Harris reported 4th quarter 2006 results. Revenue increased 21% to $992 million, up from $822 milliion in the same quarter last year. GAAP net income climbed by 39% to $85.1 million or $.61/diluted share. At that same announcement, the company raised guidance for full 2007 from $2.50 to $2.60 to $2.60 to $2.70/share. As I just noted above, the company today raised guidance once more! Besides raising guidance for the 2007 year, the company 'beat the street' reporting results ahead of expectations of $965 million in revenue and $.60/share in earnings. This is what I have referred to elsewhere as my trifecta-plus in a quarterly report: increasing revenue, increasing earnings, beating expectations AND raising guidance! Not much an investor could ask for imho.
Reviewing the Morningstar.com "5-Yr Restated" financials, we can see the steady revenue growth from $1.8 billion in 2002 to $3.5 billion in 2006. Earnings, after dipping from $.62/share in 2002 to $.45/share in 2003, have steadily increased to $1.46 in 2005 and $1.71 in 2006. The company has also steadily increased its dividend from $.10/share in 2002 to $.24/share in 2005 and $.32/share in 2006. Meanwhile, the shares outstanding have been virtually unchanged with 132 million shares in 2003, 133 million in 2006 and 134 million in the trailing twelve months (TTM).
Free cash flow has been positive at $223 million in 2004 and $232 million in 2006.
The balance sheet on Morningstar.com looks solid with $293.9 million in cash and $1,134.5 million in other current assets. When combined and compared to the $752.1 million in current liabilities, yields a current ratio of 1.90.
In addition, the company has another $728.1 million in long-term liabilities.
Looking at Yahoo "Key Statistics" on HRS, we can see that this is a large cap stock with a market capitalization of $5.94 billion. The trailing p/e is a moderate 25.98, and the forward p/e is estimated (fye 30-Jun-08) at 14.65. The PEG, with the rapid growth anticipated, is estimated at 0.99 making this valuation very reasonable imho.
According to the Fidelity.com eresearch website, HRS is in the "Communications Equipment" industrial group. Harris is reasonably priced per this site, with a Price/Sales ratio of 1.8. Leading this group is Qualcomm (QCOM) with a ratio of 9.2, followed by Adtran (ADTN) at 3.4, HRS at 1.8, Nokia (NOK) at 1.7, Motorola (MOT) at 1.5 and ADC Telecom (ADCT) at 1.3.
Relative to profitability, as measured by the return on equity (ROE), HRS is towards the bottom of the pack with an ROE of 15.2%. Leading the group is Nokia at 35.4%, Motorola at 30.1%, Adtran at 19.5%, Qualcomm at 19.3%, then HRS at 15.2% and ADC Telecom at 5.8%.
Per Yahoo, there are 133.86 million shares outstanding with 132.83 million that float. As of 8/10/06, there were 3.09 million shares out short representing 2.30% of the float or 3.3 average trading days of volume (the short ratio). The company, as noted, pays a small dividend of $.44/share (est.) for a 1% yield. The company had a 2:1 stock split last year on March 31, 2005.
How about the chart? If we examine a Point & Figure chart from StockCharts.com on Harris, we can see that the stock price, after climbing to $19 from $13 between July, 2001, and June, 2002, then fell to a low of $12 in December, 2002. Since that time, after breaking through resistance at about $15.50, the stock has moved very strongly higher to a recent high of $49 in February, 2006. The stock has consolidated somewhat the past several months and is currently at the $44 level. The stock chart looks strong to me!
In conclusion, the stock moved higher today in a steady fashion after guidance was raised again on next year's results. The company had a great recent quarter, beating expectations and raising guidance in addition to reporting solid growth in both revenue and earnings. Longer-term, the company has demonstrated a rather consistent growth in revenue with a slightly less consistent growth in earnings (although the last several years have been solid.) As an additional 'plus' the company even pays a dividend and has been increasing it each year as well. All of this on a steady number of shares outstanding.
Free cash flow is positive and the balance sheet is solid. Valuation-wise the p/e is mildly high, but with the steady growth the forward p/e is in the teens and the PEG sits at 0.99. The price/sales is average, and Return on Equity is a bit low for its group. Finally the chart looks solid.
All-in-all, I like this stock. I haven't had lots of success with defense contractors and I put this company in that group, but the numbers look nice, valuation is reasonable, and the dividend growth is also attractive. If I were in the market to be buying a stock, this is the kind of stock I would be buying today!
Thanks so much for stopping by. If you have any comments or questions, please feel free to drop me a line at bobsadviceforstocks@lycos.com or just leave them on the blog. Also, please stop by and visit my Stock Picks Bob's Advice podcast site, where you can download an mp3 and hear me talk about many of the same stocks I write about right here!
Bob
Sunday, 24 September 2006
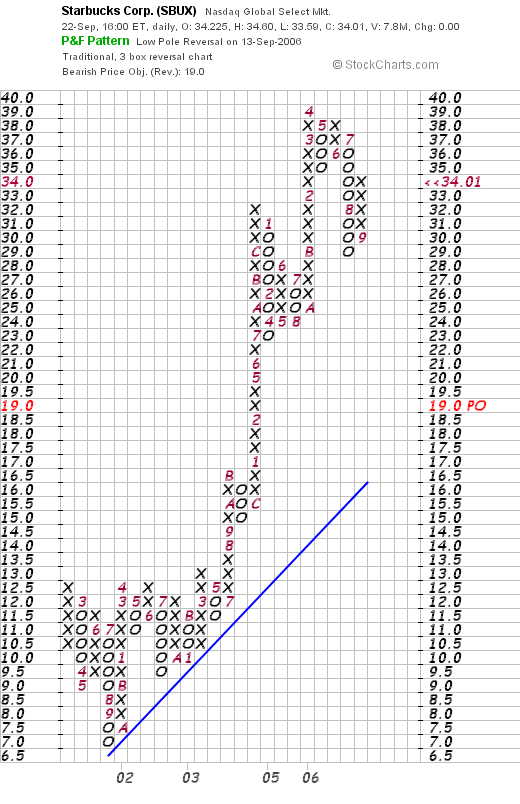
"Weekend Trading Portfolio Analysis" Starbucks (SBUX)
Hello Friends! Thanks so much for stopping by and visiting my blog, Stock Picks Bob's Advice! As always, please remember that I am an amateur investor, so please remember to consult with your professional investment advisors prior to making any investment decisions based on information on this website.
Another weekend task that I like to do around these parts is to review stocks that I actually own in my "trading portfolio". Eventually (today?) I shall try to update my trading portfolio link along the left side of this blog. Meanwhile, I shall continue to update you on my positions on a regular basis. Currently, I am trying to post a review of each holdings going alphabetically through my shortened list of holdings (still standing at eleven). Reviewing about every two weeks, my last review what on September 9, 2006, when I reviewed my ResMed holding. Going alphabetically, my next position is Starbucks (SBUX). Let's take another look at this company.
 I currently own 50 shares of Starbucks (SBUX) that were purchased on 1/24/03 with a cost basis of $11.40. SBUX closed at $34.01 on September 22, 2006, for an unrealized gain of $22.61 or 198.3% since my purchase on my remaining shares.
This is my oldest position of my eleven stocks. Unfortunately early on in my investment strategy, I was selling 1/4 positions of my holdings at targeted gains. (Now I sell 1/6th of my remaining positions). Also, I didn't buy a large position of Starbucks initially. These two factors have combined to result in a smaller current position in this terrific stock! However, I continue to manage this holding as I do all of my positions.
I have sold portions of SBUX as the stock has appreciated. That is, I sold 25 shares for a gain of $141.47 on 9/8/03, 15 shares on 1/23/04 for a gain of $185.33, 15 shares on 6/18/04 for a gain of $308.64, 10 shares on 12/3/04 with a gain of $350.78, 11 shares on 12/5/05 for a gain of $215.03, and my latest sale on 4/19/06 was 9 shares with a gain of $237.03. This represents six sales of portions of my holding at targeted appreciation points of 30, 60, 90, 120, 180, and 240% appreciation targets.
When will I be selling shares of SBUX next? Assuming no fundamentally bad news (for which I always reserve the right to arbitrarily sell all shares), I shall be selling 1/6th of my holding (8 shares) at a 300% appreciation target. This would be at a 4.00 x $11.40 = $45.60. On the downside, I would be selling all of my shares if the stock retraces to 50% of its highest appreciation sale, or at a 120% gain. Calculating this, 2.20 x $11.40 = $25.08.
Let's take another look at Starbucks and see how it is currently doing and whether it still deserves a spot on this blog!
1. What exactly does Starbucks (SBUX) do?
According to the Yahoo "Profile" on Starbucks, the company
"...engages in purchasing, roasting, and selling whole bean coffees worldwide. The company offers brewed coffees, espresso beverages, cold blended beverages, various complementary food items, premium teas, a line of compact discs, and coffee-related accessories and equipment, including drip and French press coffeemakers, espresso machines, and coffee grinders primarily through its retail stores. Starbucks also licenses its trademark for retail store operations, and grocery and warehouse club stores, as well as to produce and distribute its branded products. It also engages in producing and selling coffee drinks, espresso drink, and a line of ice creams."
2. Is there any recent news affecting the stock price?
There are many headlines on this company but the recent news of a 5 cents/drink increase in the price of beverages and an approximately 50 cents/pound increase in the price for its coffee beans suggested to analysts confidence that the company can maintain its estimated 5% same store sales increase. This news was taken positively about the company's prospects and appeared to be a bullish factor for the stock.
3. How did the company due in its latest quarterly report?
On August 2, 2006, Starbucks announced 3rd quarter 2006 results. For the quarter ended July 2, 2006, net revenues came in at $2 billion, a 23% increase over the prior year's third quarter. Net earnings climbed 16% to $145 million. Earnings per share were up 12.5% to $.18/share, up from $.16/share last year. In addition, the company reported same-store sales growth of 4% which was a bit lower than past months' results. To give a sense of scale of this company, within the report they announced plans to open approximately 2,400 net new stores in fiscal 2007. This was an increase over the 2,000 stores estimated to be opened in fiscal 2006.
4. What are the longer-term financial results for this company?
Reviewing the Morningstar.com "5-Yr Restated" financials on Starbucks, we can see the record of steady revenue growth from $2.6 billion in 2001 to $6.4 billion in 2005 and $7.4 billion in the trailing twelve months (TTM).
Earnings during this period have also steadily increased from $.23/share in 2001 to $.61/share in 2005 and $.72/share in the TTM. Interestingly, the number of shares, which was at 780 million in 2003, increased to 794 million in 2004 and then have declined to 785 million in 2005 and 756 million in the TTM due to company share buy-backs.
Free cash flow has been positive with $238 million in 2003, increasing to $280 million in 2005 and $404 million in the trailing twelve months (TTM). This growth in free cash flow has occurred in the face of the large increase in capital spending from $378 million in 2003 to $696 million in the TTM. Presumably, this spending is related to both the share buy-backs and expenses related to opening new stores.
The balance sheet, while adequate, are a bit heavy in current liabilities. The company is reported to have $442 million in cash and $927 million in other current assets. When combined, this $1.37 billion in current assets, just covers the $1.32 billion in current liabilities yielding a current ratio of 1.04. Adequate but not impressive. The company fortunately has long-term liabilities of only $224.6 million. In addition, with the $400 million in free cash flow on an annualized basis, this balance sheet is probably more than adequate.
5. What about some valuation numbers on this company?
If we review the Yahoo "Key Statistics" on Starbucks, we find that this is a large cap stock with a market capitalization of $25.71 billion. This company is richly-valued with a trailing p/e of 52.32 and a forward p/e estimated at 40.01 (fye 02-Oct-07). Based on the 5 yr expected earnings, the PEG is also rich at 2.36.
If we examine the results from the Fidelity.com eresearch website, we find that Starbucks has been assigned to the "Specialty Eateries" industrial group. Within this group, Starbucks is moderately priced with a Price/Sales ratio of 3.6. Topping this group is Tim Hortons (THI) with a ratio of 7, following Starbucks is Panera (PNRA) with a ratio of 2.7 and Caribou Coffee (CBOU) at a much cheaper 0.6.
Looking at profitability, as measured by the Return on Equity (ROE), Starbucks is tops in this department with a ROE of 24.7%. This is followed by Tim Hortons at 19.2%, Panera at 17.4% and at the bottom of the list is Caribou with a (6.7)% ROE. (Sometimes 'cheaper' isn't better!)
Returning to Yahoo, they report 756.07 million shares outstanding with 746.87 million that float. Currently there are 20.22 million shares out short representing 2.7% of the float and 4 trading days of volume (the short ratio). Slightly exceeding my own 3 day rule for short interest, this may potentially help the stock on the upside in the face of any good news. The company does not pay a dividend and the last stock split was a 2:1 stock split October 24, 2005.
6. What does the chart look like?
If we review the "Point & Figure" chart on Starbucks from StockCharts.com, we can see that while the stock price initially consolidated in a tight range between February, 2002 and March, 2003, beetween $12.50 and a low of $7.00, the stock broke out strongly in March, 2003, and has moved higher since to a high of $39 in April, 2006. The stock has been correcting but has not broken its up-trend imho.
7. Summary: What do I think about this stock?
Let's review some of the many aspects of this stock I have touched on in the above review. First of all, I own shares of Starbucks so my analysis is certainly colored by this bias. But trying to be as frank as possible, Starbucks is above all the classic growth stock story. They have a quality product and have been a true category-killer in the coffee market. Most recently, they had the power (perhaps explained by a moat) to announce an increase to their coffee drinks and coffee beans.
The latest quarter showed positive sales and earnings growth. However, same-store sales growth in the 4% range is a bit anemic. In addition, the company has announced plans for a 2,700 store addition. It will be instructive to observe their execution of this large expansion. The Morningstar.com report shows the impressive growth in revenue and earnings and the recent decline in shares outstanding. The company is able to produce an increasing flow of free cash but the balance sheet is a bit heavy on current liabilities with current assets just covering them.
Valuation-wise, the p/e is rich in the 50's and a forward p/e above 40. Thus, the PEG, at 2.8, also suggests that even with anticipated growth, the stock is richly priced. On the plus side, the Price/Sales ratio is more-or-less reasonable within its small specialty eateries group. And the ROE is tops in the group demonstrating its profitability. There are a significant number of investors/speculators betting against Starbucks with a relatively large number of shares out short. Finally, the chart looks strong with a steady increase in share price the past 3 years.
So what do I think? Well, I am glad I have owned Starbucks since 2003. I am not sure I would be a buyer in here although it never has paid to bet against this company. I am a bit concerned over a few factors: the relatively rich valuation with a p/e in the 50's and a PEG at 2.8, and what appears to be a moderation in same-store sales growth. Coupled with a balance sheet showing a large level of current liabilities....with the committment to buy back shares AND open 2,700 outlets....is this a stretch? Meanwhile, I am staying put with my small 50 share investment. I suspect Starbucks will come through and doubters will once again find themselves on the outside....
Thanks so much for stopping by and visiting! If you have any comments or questions, please feel free to leave them on the blog or email me at bobsadviceforstocks@lycos.com. Also, be sure and visit my Stock Picks Bob's Advice podcast site where you can listen to me talk about many of the same stocks on the blog!
Bob
Saturday, 23 September 2006
"Looking Back One Year" A review of stock picks from the week of May 23, 2005
Hello Friends! Thanks so much for stopping by and visiting my blog, Stock Picks Bob's Advice! As always, please remember that I am an amateur investor, so please remember to consult with your professional investment advisors prior to making any investment decisions based on information on this website.
Once again it is the weekend and for me that means I should take a look at past stock picks to see how they turned out! For the sake of this review, I continue to assume a "buy and hold" strategy for all stocks discussed. For performance evaluations, I am assuming that one purchased equal dollar amounts of all stocks that week and I am simply doing an average of the % change of each stock reviewed.
In actual practice I employ and recommend a disciplined ownership strategy of selling losing stocks quickly on small losses and selling gaining stocks partially and slowly at targeted appreciation levels. It is this bias that I believe will result in profitable portfolios longterm. This blog is an ongoing experiment in that approach.
 On May 23, 2005, I posted Dynamic Materials (BOOM) on Stock Picks Bob's Advice when it was trading at $37.64/share. BOOM had a 2:1 stock split on October 13, 2005, making my effective stock pick price $18.82. BOOM closed at $32.83 on September 22, 2006, giving my selection an appreciation of $14.01 or 74.4% since being posted.
On August 3, 2006, Dynamic materials reported 2nd quarter 2006 earnings. Sales for the quarter ended June 30, 2006, climbed 51% to $27.8 million from $18.4 million in the same quarter the prior year. Sales were up 10% sequentially from the prior quarter. Net income climbed 137% to $5.0 million or $.41/diluted share up from $2.1 million or $.18/diluted share in the prior year. Analysts had expected $24 million and earnings of $.28/share. Although the company dampened expectations about the upcoming quarter, they expected the following fourth quarter to be strong.
 On May 24, 2005, I posted Forward Industries (FORD) on Stock Picks Bob's Advice when it was trading at $20.43/share.
FORD closed at $5.12 on September 22, 2006, for a loss of $(15.31) or (74.9)% since posting.
On July 27, 2006, Forward Industries announced third quarter 2006 results. For the quarter ended June 30, 2006, net sales dropped sharply to $7.3 million compared with $13.1 million for the same three months in 2005. Net income came in at $285,000 or $.04/diluted share in the 2006 quarter, compared with $2.6 million or $.33/diluted share in the same quarter in 2005.
 Finally, on May 26, 2005, I posted Michaels Stores (MIK) on Stock Picks Bob's Advice when the stock was trading at $41.25. MIK closed at $43.22 on September 22, 2006, for a small gain of $1.97 or 4.8% since posting.
On August 23, 2006, Michaels announced their 2nd quarter 2006 results. For the quarter ended July 29, 2006, total sales came in at $768.3 million, a 3.1% increase over the prior year same period sales. Same-store sales, however, decreased (0.3)%. Net income for the second quarter came in at $20.3 million and diluted earnings were $.15/share. This was up from $16.5 million in sales and $.12/share in earnings. The company did provide guidance of an increase in same-store sales of 1% to 3% for the next quarter with total sales gaining 4% to 6%. However, even though sales figures were up for the latest quarter, the negative same-store sales growth certainly creates some concern about the vigor of the earnings prospects.
So how did I do with these three stock picks for that week in May last year? Basically, the phenomenal performance of Dynamic Materials was negated by the awful performance of Forward Industries. Thus, with the small positive growth reported by Michaels, the average performance for the three stocks is a small 1.4%.
Thanks so much for stopping by and visiting my blog! If you have any comments or questions, please feel free to email me at bobsadviceforstocks@lycos.com or just leave your comments right on the blog itself! Please be sure to take the time and visit my Stock Picks Podcast Website where you can, for the past year, hear me talk about stocks in addition to the possibilities of reading about them.
Bob
Posted by bobsadviceforstocks at 3:42 PM CDT
|
Post Comment |
Permalink
Updated: Sunday, 24 September 2006 12:03 AM CDT
Friday, 22 September 2006
September 22, 2006 HEICO (HEI)
CLICK HERE TO GET TO MY PODOMATIC PAGE FOR MY PODCAST.
Hello Friends! Thanks so much for stopping by and visiting my blog, Stock Picks Bob's Advice! As always, please remember that I am an amateur investor, so please remember to consult with your professional investment advisors prior to making any investment decisions based on information on this website.
Even though the overall market tone is poor today, I wanted to see if I could find another stock to discuss with all of you readers. When investing, it is helpful to build a portfolio of stocks. But it is always the challenge of deciding which stocks are best to be owning within that portfolio. I hope that these discussions are helpful to you in making your own decisions about possible stock selections. But do consult with professional advisors as well.
 Over the years, I have employed a stock-picking system that starts with an examination of the top % gainers that day on the NYSE, the NASDAQ, and sometimes the AMEX as well. Looking through the list of top % gainers on the NYSE today, I came across HEICO Corporation (HEI) which as I write is trading at $34.53, up $1.13 or 3.38% on the day. Often this low a % gain is not sufficient for a stock to make the top % gainers list. However, on a declining day, it suffices.
I do not own any shares nor do I have any options on this stock. However, I reviewed the things I have found important on an investment and believe that this is a stock that deserves a spot on my blog! Let me share with you the factors that led me to this decision.
1. Was there any news that led the stock to move higher today?
Reviewing the news on the stock, I saw that Sun Trust Robinson Humphrey had raised its opinion on HEI from "neutral" to buy. This apparently was enough to push the stock higher today.
2. What exactly does this company do?
According to the Yahoo "Profile" on HEICO, the company
"... through its subsidiaries, engages in the design, manufacture, and sale of aerospace, defense, and electronics related products and services in the United States and internationally. It operates in two segments, Flight Support Group and Electronic Technologies Group."
3. How did they do in the latest quarter?
On August 30, 2006, HEI reported 3rd quarter 2006 results. Net sales for the quarter ended July 31, 2006, increased 48% to $102.1 million, up from $69.2 million in the same quarter last year. Net income came in at $8.28 million, up 37% from $6.05 million, or $.31/diluted share, up from $.23/diluted share in the same period last year. In light of these strong results, the company went ahead and raised guidance on the full year to $378 to $380 million in revenue (up from $370 to $376 million guidance provided in June), $66 to $67 million in operating income, and net income in a range from $1.14 to $1.16/share (up from the $1.09 to $1.12/share guidance in June) . The current quarter's net income exceeded by $.03/share the $.28/share expected by analysts. The revenue figure also exceeded the $92.5 million expected by analysts polled by Thomson Financial.
In my slang, I call this a 'trifecta-plus'. That is, the company reported strong revenue AND earnings growth, beat expectations and raised guidance. The best that can be expected from a quarterly report imho.
4. What about longer-term financial results?
Looking at the "5-Yr Restated" financials on HEI from Morningstar.com, we can see the steady growth in revenue from $171.3 million in 2001 to $269.6 million in 2005 and $325.9 million in the trailing twelve months (TTM).
Earnings, however, have been a little less consistent, dropping from $.65/share in 2001 to $.50/share in 2003. However, since 2003, earnings have steadily increased to $.87/share in 2005 and $1.02 in the TTM.
The company also pays a small dividend, with $.05/share paid in 2001 through 2005, and $.07/share paid in the TTM.
The number of shares outstanding has been relatively stable, increasing from 22 million in 2001 to 25 million in 2005 and the TTM.
Free cash flow has been positive with $24 million in 2003, $28 million in 2005 and $22 million in the TTM.
The balance sheet as presented by Morningstar.com appears solid with $5.4 million in casha nd $152 million in 'other current assets'. This total of $157.4 million can easily cover the $45.1 million of current assets and cover most of the long-term liabilities which are reported at $151.5 million. the current ratio works out to a 'healthy' 3.49.
5. What about some 'valuation' numbers on this stock?
Referring to Yahoo "Key Statistics" on HEICO, we can see that this is a mid-cap stock with a market capitalization of $865.60 million. The trailing p/e is a moderate 31.05, and the forward p/e is estimated (fye 31-Oct-07) at a nicer 24.77. The PEG is a tad rich at 1.51.
According to the Fidelity.com eresearch website on HEICO, this company is in the "Aerospace/Defense-Products/Services" industrial group. Within this group, HEI is relatively richly priced relative to the Price/Sales ratio which tops the group at 2.5. Also at 2.5 is Rockwell Collins (COL) at 2.5, Honeywell (HON) follows at 1.1, Goodrich (GR) at 0.9, Lockheed Martin (LMT) at 0.9, and Northrop Grumman (NOC) at 0.8.
Insofar as profitability is concerned, utilizing the Return on Equity (ROE) as a measure, HEI also comes in low at 10.1%. This only is better than Northrop at 8.4%. Leading the group is Rockwell at 42.8%, Lockheed Martin at 27.8%, Goodrich at 24.3%, honeywell at 17%, followed by HEI at 10.1% and Northrop at 8.4%.
Even though these numbers do not particularly show this company to be a great 'value', the strong revenue and earnings growth just reported suggests that investors are looking beyond these 'static' numbers which are about valuation based on current performance, but are pricing into this stock future earnings and revenue expectations.
Returning to Yahoo for a few more numbers, we find that there are 25.32 million shares outstanding with 16.12 million that float. Now here is the interesting piece of information. Yahoo is reporting, as of 8/10/06, 2.40 million shares out short, up from 2.14 million the prior month. With the average volume of only 119.6 thousand shares, this represents a whopping 21.4 trading days of volume out short. It is no surprise to me, as I use a '3-day rule' to assess current ratios, that with the good earnings news this past week or so, the company has rallied strongly, likely both from investors buying shares for the first time as well as speculators covering their bad 'bet'.
As noted above, the company is paying a small (but increased) dividend of $.08/share yielding 0.20% The last stock split was reported January 2, 2004, when the stock had an 11:10 split. (what most people would refer to as a 10% stock dividend).
6. What does the chart look like?
If we take a look at the "Point & Figure" chart from StockCharts.com on HEICO, we can see that the stock was actually declining between January, 2001 when the stock was at $16, and when it bottomed in April, 2003 at $7.00. (This corresponds with the drop in earnings during that same period....once again re-emphasizing the correlation between earnings performance and stock price performance imho.). After breaking through resistance at the $11.50 level in June, 2003, the stock has subsequently traded higher to its current level near $35.
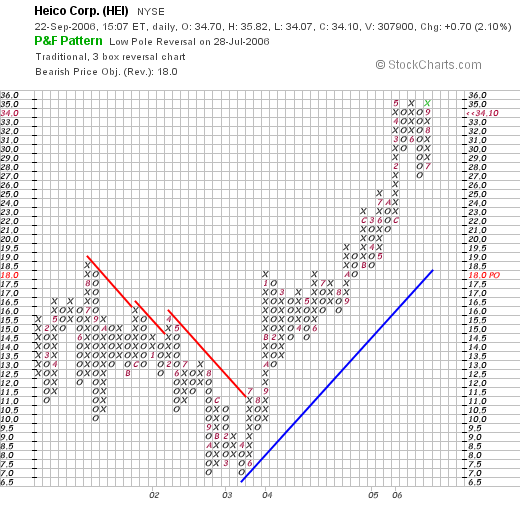
7. Summary: What do I think about this stock?
In conclusion, I find HEICO to be an interesting stock pick for this blog. They are a relatively small sized company (mid cap to be precise) with relatively few shares outstanding. They just reported great results beating expectation on both revenue and earnings and guided analysts higher for the next quarter. The Morningstar.com fundamentals look nice with steady revenue growth, steady earnings growth for the last 3 years, positive free cash flow, and a solid balance sheet. Valuation-wise the PEG is at 1.5, the Price/Sales and ROE are a bit rich. An interesting footnote is the large number of shares out short. We may well be watching a continued slow 'squeeze' of the short-sellers. Finally, the chart looks nice.
What I haven't told you is my familiarity with the product. What I call the "Peter Lynch" portion of my analysis. I am not familiar with their products but like the stock due to the underlying performance of the company.
Thanks so much for stopping by and visiting my blog! If you have any comments or questions, please feel free to leave them on the website or email me at bobsadviceforstocks@lycos.com. Also, please be sure to drop by and visit my Stock Picks Podcast Website where you can hear me as well as read what I write!
Bob
Posted by bobsadviceforstocks at 2:37 PM CDT
|
Post Comment |
Permalink
Updated: Sunday, 24 September 2006 6:20 PM CDT
Newer | Latest | Older


