Stock Picks Bob's Advice
Friday, 16 March 2007
A Reader Writes "How do I follow your portfolio?"
Hello Friends! Thanks so much for stopping by and visiting my blog, Stock Picks Bob's Advice! As always, please remember that I am an amateur investor, so please remember to consult with your professional investment advisers prior to making any investment decisions based on information on this website.
 I very much enjoy receiving letters from readers.
I had a nice note earlier today from Al B. who wrote simply:
"How do I follow your portfolio?
Thanks,
Al"
That doesn't sound like an unfair question to me. Unfortunately, you probably won't like my answer. But what I have been doing, is every several months, writing up an update of all of the stocks I own, my cost basis, the date of purchase, and the current unrealized gain (or loss) on each holding. When I first started writing this blog---way back in 2003---I tried to regularly update my Trading Portfolio and the list of all of the stocks 'picked'. Being the amateur that I am, this was a job beyond my time constraints and I simply gave up.
So I try to do this regularly and meanwhile, each time that I do a trade, I post a note called "trading transparency", kind of like my latest note on my unfortunate foray into Angeion, a company that otherwise suits my needs on this blog.
But since you are asking, let me pull up my account and review my holdings with you. I currently have 17 positions, out of my maximum planned 25 holdings. These results are as of the close of trading today 3/16/07.
Company (symbol), number of shares, date purchased, cost basis, closing price, unrealized gain (loss)
Bolt Technology (BTJ), 209 shares, 1/12/07, $17.44, $30.73, 76.24%
Cerner Corp (CERN), 120 shares, 2/2/07, $49.76, $55.64, 11.81%
Coach (COH), 71 shares, 2/25/03, $8.33, $48.77, 485.39%
Cytyc (CYTC), 188 shares, 1/29/04, $14.86, $33.07, 122.60%.
Hologic (HOLX), 120 shares, 1/31/07, $55.58, $54.12, (2.63)%
Harris (HRS), 120 shares, 1/31/07, $50.05, $47.65, (4.80)%
Jones Soda (JSDA), 300 shares, 3/12/07, $18.22, $18.85, 3.48%
Kyphon (KYPH), 125 shares, 5/20/05, $29.21, $42.85, 46.67%
Morningstar (MORN), 140 shares, 11/22/05, $32.57, $51.12, 56.93%
Precision Castparts (PCP), 100 shares, 10/24/06, $69.05, $99.84, 44.59%
Quality Systems (QSII), 88 shares, 7/28/03, $7.75, $38.42, 395.81%
ResMed (RMD), 150 shares, 2/4/05, $29.87, $47.58, 59.30%.
Starbucks (SBUX), 50 shares, 1/24/03, $11.40, $30.58, 168.13%.
Universal Electrs (UEIC), 180 shares, 2/23/07, $25.24, $27.38, 8.48%.
Meridian Bioscience (VIVO), 210 shares, 4/21/05, $11.13, $28.01, 151.70%.
Ventana Medical Systems (VMSI), 188 shares, 4/16/04, $23.47, $39.68, 69.07%.
Wolverine World Wide (WWW), 200 shares, 4/19/06, $23.55, $28.28, 20.11%.
As of 3/16/07, my stock holdings stood at $99,116.95, with a margin debit balance of $54,961.58, for a net value of $44,155.37.
The total of unrealized gains were $31,124.44.
During 2007, I have taken realized net short-term gains of $471.95, and realized net long-term gains of $2,140.72, for a total net realized gain of $2,612.67.
During 2006, I had a total realized gain of $5,460.82, consisting of a net short-term loss of $(5,237.30) and a net long-term gain of $10,698.12.
I hope this helps you understand what my holdings are, my current performance of my holdings and my net trading results for 2006 and 2007. If you have any comments or questions, please feel free to leave them on the blog or email me at bobsadviceforstocks@lycos.com.
Bob
Manitowoc Company (MTW) "Revisiting a Stock Pick"
Hello Friends! Thanks so much for stopping by and visiting my blog, Stock Picks Bob's Advice! As always, please remember that I am an amateur investor, so please remember to consult with your professional investment advisers prior to making any investment decisions based on information on this website.
 I was looking through the list of top % gainers on the NYSE today and came across one of my favorite Wisconsin companies, Manitowoc (MTW) which closed at $59.65, up $4.18 or 7.54% on the day. I do not own any shares of Manitowoc, but I have encouraged my Stock Club to buy some shares, and have purchased some shares for my wife's IRA as well as a few shares for a couple of my kids' accounts. I also say 'favorite' because I have blogged about this stock previously. In fact, I first discussed Manitowoc on Stock Picks Bob's Advice on November 22, 2004, when the stock was at $38.29 (actually $19.15 when adjusted for a 2:1 stock split April 11, 2006). I then first "revisited" Manitowoc on Stock Picks on January 11, 2006, when the stock was trading at $58.70 ($29.35 when adjusted for the 2:1 stock split a few months after that post).
Here is the recent "Point and Figure" chart on Manitowoc from StockCharts.com:
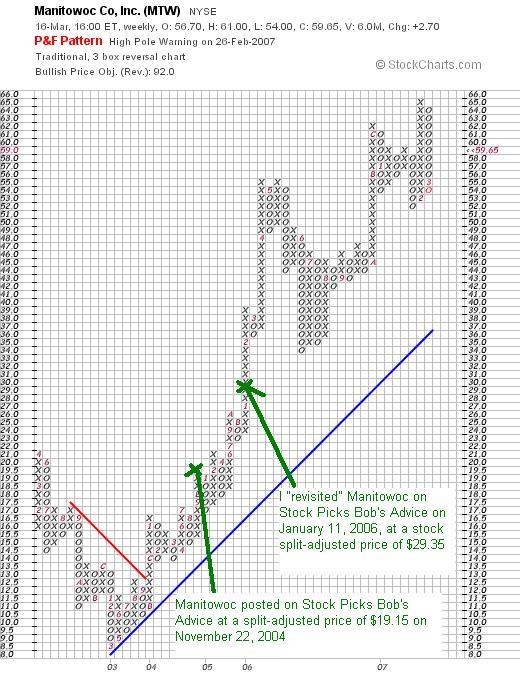
Let's take another look at Manitowoc and I will share with you why I believe it still deserves a place on this blog.
What exactly does this company do?
According to the Yahoo "Profile" on Manitowoc, this company
"...engages in the manufacture and marketing of cranes and related products, foodservice equipment, and marine products in the United States and internationally. It operates through three segments: Cranes and Related Products (Cranes), Foodservice Equipment (Foodservice), and Marine."
How did they do in the latest reported quarter?
On January 30, 2007, Manitowoc (MTW) reported 4th quarter 2006 results. Net sales climbed 32% to $775.2 million from $589.3 million in the 2005 quarter. Net earnings more than doubled to $43.9 million in the 2006 4th quarter compared to $18.2 million in the 4th quarter of 2005. Diluted eps also increased more than 100% to $.69/share, up from $.30/share the prior year. As good as these results were, the stock dropped on an analyst downgrade from Robert Baird. As reported:
"Baird's Robert F. McCarthy cut his rating on the stock to "Neutral" from "Outperform" and price target by $10 to $56, citing a slowing of crane order growth and lower-than-expected food service results in the fourth quarter.
"While cycle-to-cycle financial performance has been impressive and near-term financial prospects appear robust, we believe moderating order growth for the segment that now accounts for 80 percent of operating income makes the stock vulnerable to multiple compression," McCarthy wrote in a note to investors.
Fourth-quarter crane orders were estimated at $705 million, representing a 5 percent increase over the prior year's period, but a 2 percent decrease from the third quarter of 2006, McCarthy said.
Manitowoc officials said the company's foodservice equipment business was hurt by higher commodity costs and weak beverage equipment sales. The unit's operating income slipped to $9.2 million from $10.9 million in the prior-year quarter."
It should be noted that even while the Baird analyst was downgrading the stock, the quarterly report beat expectations of earnings of $.67 (the company came in at $.69/share) on revenue of $761 million (the company came in at $775.2 million).
In fact, business has remained strong for Manitowoc. As reported yesterday after the close of trading, the company raised guidance for fiscal 2007, raising per share guidance from $3.85 to $4.00 to a range of $4.20 to $4.30. Also, the company suggested that reported earnings per share for the first quarter of 2007 will "exceed the average of published Wall Street estimates by approximately 10 percent." This announcement yesterday was the cause of the interest in the stock today even though the rest of the market was selling off!
How about longer-term results?
Reviewing the Morningstar.com "5-Yr Restated" financials, you can see why I like this stock so much and why I believe it has performed so well.
First of all revenue. This has grown steadily from $1.05 billion in 2001 to $2.3 billion in 2005 and $2.7 billion in the trailing twelve months (TTM).
Next earnings. Except for a dip from $.93 in 2001 to a loss of $(.40) in 2002, earnings have steadily grown to $1.07/share in 2005 and $2.25/share in the TTM. The company also pays a dividend which while increased from $.15/share in 2001, to $.32/share in 2002, has been $.14/share from 2003 to the TTM.
During this period, the company has expanded the number of shares from 49 million to 62 million...a slightly greater than 25% increase in shares while revenue climbed over 100% and earnings were also up about 100%. This is an acceptable trade-off imho.
Free cash flow, while dipping from $119 million in 2003, to $14 million in 2004, increased to $52 million in 2005 and $144 million in the trailing twelve months.
The balance sheet appears adequate with $113.5 million in cash and $947.1 million in other current assets giving a total of $1.06 billion in total current assets. When compared to the $835.8 million in current liabilities this yields a satisfactory current ratio of 1.27.
What about some valuation numbers?
Looking at Yahoo "Key Statistics", we find that Manitowoc is a mid cap stock with a market capitalization of $3.71 billion. The company has a nice trailing p/e of 22.53 with a forward p/e (fye 31-Dec-08) of only 12.53. Thus the PEG comes in at a very attractive (to me) 0.90.
According to the Fidelity.com eresearch website, MTW has a Price/Sales ratio of 1.16 compared to an industry average of 1.32. The company, while being cheaper in valuation that the average in its industry is also more profitable, at least as measured by the return on equity (TTM) which comes in at 24.75%, compared to an industry average of 22.82%.
Yahoo reports 62.14 million shares outstanding with 60.05 million that float. There are only 1.21 million shares out short as of 2/12/07, representing 1.4 trading days of volume (less than my 3 day rule for significance in a 'short ratio'), and this represents 2% of the float. The company as noted pays a forward dividend of $.14/share yielding 0.3%. The last stock split, as I noted above, was a 2:1 split last year on April 11, 2006.
What does the chart look like?
If we review the above chart, we can see that since bottoming around $8 in 2003, the stock has literally been on a tear, moving strongly higher. In other words the chart looks great to me.
Summary: What do I think?
This is one great company! And on top of this it is from Wisconsin as well. Boy do I love those Badger-state companies :). Seriously, this is the third time I have written up this stock and it still looks interesting! The latest quarter was strong. The company beat expectations on both earnings and revenue and just yesterday raised guidance for the next quarter and year. The company has been raising its revenue and growing earnings steadily for several years. They even pay a small but steady dividend and the number of shares has grown far slower than the rate of revenue and earnings growth. Free cash flow is positive and growing recently and the balance sheet looks nice.
To top it off, valuation is cheap with a p/e in the low 20's, a forward p/e in the teens, a PEG under 1.0, a Price/Sales lower than average in its group and a ROE higher than average. Finally the chart looks strong! I like this stock a lot and if I were in the market to buy some shares today, this is the kind of stock I would be buying. Meanwhile, it remains in my vocabulary for future consideration as I like to say.
Thanks so much for stopping by and visiting! If you have any comments or questions, please feel free to leave your comments on the blog or email me at bobsadviceforstocks@lycos.com. If you get a chance, you are welcome to drop by my Stock Picks Podcast Site where I from time to time podcast a stock or two that I write up here on the blog!
Bob
Posted by bobsadviceforstocks at 10:19 PM CDT
|
Post Comment |
Permalink
Updated: Friday, 16 March 2007 11:05 PM CDT
Thursday, 15 March 2007
Angeion (ANGN) "Trading Transparency"
Hello Friends! Thanks so much for stopping by and visiting my blog, Stock Picks Bob's Advice! As always, please remember that I am an amateur investor, so please remember to consult with your professional investment advisers prior to making any investment decisions based on information on this website.
I had an email the other day suggesting that maybe my Angeion purchase was a bit too volatile to be held long term. I don't know about that, but certainly with my 'disciplined' trading strategy, any new stock addition is subject to a quick sale even if the long-term prospects seem just fine. Especially if they are a lower-priced and relatively thinly traded stock like Angeion. O.K. enough excuses. I was checking my portfolio this noon and noticed that Angeion had hit and actually exceeded my 8% loss limit on a holding. Even if it is true that I had just purchased it.
So a few moments ago I sold my 300 shares of Angeion at $13.77. If you can believe it, as you must probably know, I just purchased Angeion (ANGN) for my trading account just two days ago (!) on the 13th at a price of $15.09. Thus, this represented a quick loss of $(1.32) or (8.75)% on this trade. I don't care if I have held a stock for two hours or two days, if the stock hits that 8% loss, out it goes. Furthermore, since this is a sale on 'bad news' (do I need to explain that taking a loss is bad news?), I use this as a 'signal' that things aren't perfect in my portfolio so I 'sit on my hands' and shall not be using the proceeds for anything (except to pay down my growing margin balance.)
Thanks so much for stopping by and visiting! If you have any comments or questions, please feel free to email me at bobsadviceforstocks@lycos.com or just leave your comments on the blog. If you get a chance, be sure and visit my Stock Picks Podcast Website. And if I get a chance, I shall have to get around to a new podcast. It has been a few weeks and I need to put together a new 'episode'.
Bob
Wednesday, 14 March 2007
My Second Worst Stock Pick!
I thought I would share with you the other stock in the sub-prime lending market that made its way onto this blog. While it may be that you could have ridden the stock up to a gain, the stock has recently been under increasing selling pressure. Here is my entry, again back in 2003 when I was just 'getting going' here on Stock Picks.
Monday, 9 June 2003
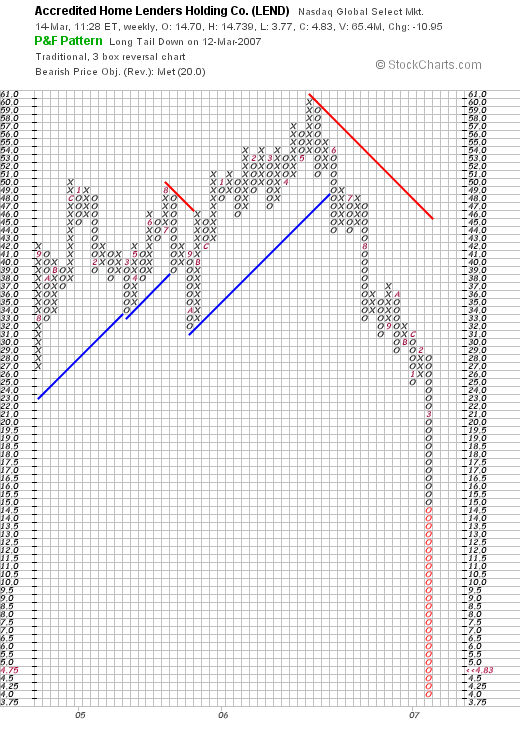
June 9, 2003 Accredited Home Lenders Holding Co. (LEND)
It is Monday morning. I was GOING to update the main page on this site....but didn't get to it. This weekend was graduation weekend for my senior and well.....enough excuses!
Anyhow, market a little soft today, getting a bit of a rest. This stock showed up on the NASDAQ top gainers and is worth a look. I have never heard of it before, it is actually a relatively new issue, and nobody in my family including me has any shares.
LEND is according to CNN.money, "a nationwide mortgage banking company that originates, finances, sells, securitizes and services subprime mortgage loans secured by single-fammily residences." Sounds a little like our New Century Finance...and look how well THAT one has done.
The stock is currently trading at $19.58 up $1.63 on the day or 9.08% to the upside.
On April 29th, LEND reported first quarter results. As noted on the news report from NYTimes on the web, LEND was founded in 1990, and came public in the first quarter of the year.
Total revenues for the quarter increased by 111% to $79.1 million from $37.5 million for the prior year (!). Net income was $14.8 millionl, or $.85/share, a 170% increase from the $37.5 million for the comparable quarter in 2002 (!!!).
Morningstar shows a steady improvement in annual revenue from $12.6 million in 1997, $18.3 million in 1998, $39.3 million in 1999, $56.6 million in 2000, and $96.5 million in 2001. Based on the $79.1 million in revenue for the first quarter, 2003 could bring in up to $300 million. This is a very pretty progression!
Morningstar is a bit spotty on the results regarding free cash flow and assets/liabilities...but watch this site for updates as the company is public longer.
The stock jumped today on guidance from the company, with second quarter eps raised to $1.20-$1.25 and full year eps guidance raised to $3.50-$3.75.
This is a very interesting stock, and if it performs anything like NCEN, represents a good buying opportunity right here.
Bob
It is interesting if you look at the LEND chart, you will see that if you had purchased shares in LEND, and sold at intervals, and sold when the stock declined you probably would have done real well following this pick advice. However, it also shows the problems of 'buying and holding' without managing your stock holdings.
Thanks so much for stopping by and visiting! If you have any comments or questions, please feel free to leave them on the blog or email me at
bobsadviceforstocks@lycos.com.
Bob
My Worst Stock Pick Ever!
Just to show you that I am fallible, that I have a sense of humor, and can poke fun even at myself, I would like to share with you an early entry that I wrote up on May 22, 2003. This was my entry on New Century Financial (NCEN):
Thursday, 22 May 2003
May 22, 2003 New Century Financial (NCEN)
As you can see from my post yesterday on the main website page here (http://bobsadviceforstocks.tripod.com), I am an owner of New Century Financial...in my trading account. I have actually purchased this several times starting in 12/02 when I purchased 100 at an average cost of $23.41, 12/24/02 another 100 at an average cost of $26.68, and a final 100 at an average cost of $28.03. Following my own rules, I sold 100 on 5/5/03 for an average cost of $39.93. I had reached over a 50% gain in this issue in a short period of time and starting lightening up a little. So important to sell losses QUICKLY and sell gainers SLOWLY. Can only help to bias your results to the upside.
Anyhow, NCEN is having a GREAT day trading at $47.02 up $6.57 as we write at 9:22 am Central Time. What caused this pop is the fact that NCEN TODAY announced that in was INCREASING 2003 eps guidance from the $7.40-$7.50 range up to $8.75 to $9.25 range. Yes....this company is anticipating earnning about $9.00 per share (!!!) and sells even after this move for only $46. The company "is engaged in originatin, purchasing, selling and servicing subprime mortgage loans secured by first mortgages on single-family residences," according to the CNN.money site http://money.cnn.com/MGI/snap/A1434.htm (I hope that works for you to get to the profile section). Last quarter total revenues rose 61% to $181 million and net income rose 50% to $45.7 million.
Looking at Morningstar.com on this issue, we find
sequential growth in revenue from $98.6 million in 1997, $176.4 million in 1998, $233.9 million in 1999, $163.9 million in 2000 (which IS a drop which I would RATHER not see....but the rest of this is so good!), $293.3 million in 2001 and $511.1 million in the 'trailing twelve months'.
In addition, in today's announcement, NCEN indicated that they would maintain their $.10/share dividend (an added plus)...which means in effect a 50% increase in effective dividend return. This is a 50% increase because they announced a 3 for 2 stock split.
Unfortunately, Morningstar does not have the free cash flow report but interestingly does have the growth in revenue the last four quarters showing a 779.39%, 134.17%, 117.42%, and 86.84% increase in revenue each quarter. Pretty impressive!
For a final note, even AFTER today's big price rise, NCEN sells at a p/e ratio of only 6.18 suggesting tremendous value in their shares.
As a caveat, I know NOTHING about the management of this company...and would hold to an 8% stop loss on any purchase which I always suggest on all issues. If the stock should rise further....start selling some shares at a 40-50% range in gain....this is really an insurance of reducing your overall cost on any purchase. Good luck and happy investing.
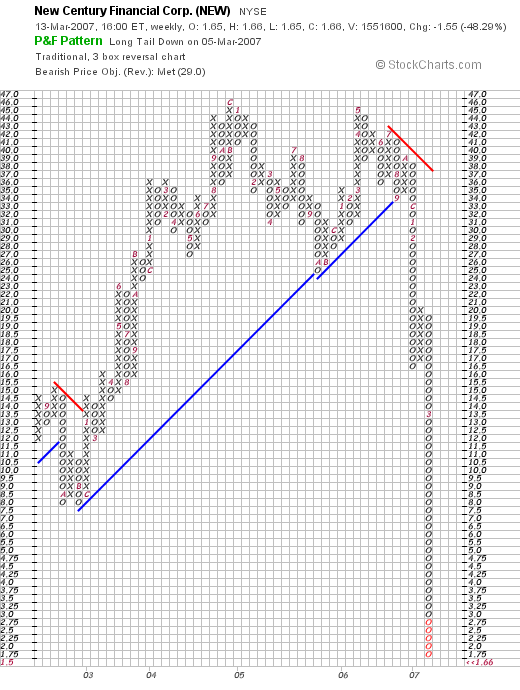
I do not need to tell you about the sub-prime lending market do I? And the fiasco it is in? Anyhow, you can see my current reluctance in writing up financial stocks (I still do....), and the need to take your gains when you can and limit your losses!
Have a great day trading.
Bob
Posted by bobsadviceforstocks at 9:31 AM CDT
|
Post Comment |
Permalink
Updated: Wednesday, 14 March 2007 10:49 AM CDT
Tuesday, 13 March 2007
Cytyc (CYTC) and Angeion (ANGN) "Trading Transparency"
Hello Friends! Thanks so much for stopping by and visiting my blog, Stock Picks Bob's Advice! As always, please remember that I am an amateur investor, so please remember to consult with your professional investment advisers prior to making any investment decisions based on information on this website.
It was another awful day in the market. No two ways about it. The Dow closed down (242.66) to 12,075.96, and the NASDAQ was down (51.72) closing at 2,350.57.
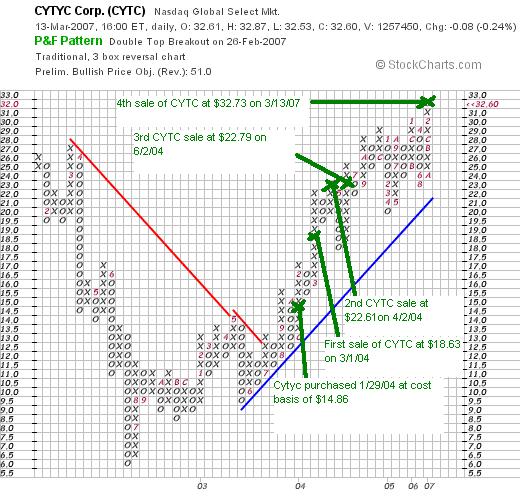
Early on today, in the midst of this eventually dismal trading day, one of my stocks hit a sale point at a gain. Cytyc (CYTC) which closed at $32.60, off $(.08) or (.24)% on the day, actually was up this morning, enough to hit a sale point for me at an appreciation target. I acquired my 225 shares of Cytyc 1/29/04, a bit over 3 years ago, at a cost basis of $14.86. This morning, with Cytyc trading slightly higher, the shares hit a 120% gain for me, and I sold 1/6th of my position, or 37 shares, at $32.73. After it was all done, this represented a gain of $17.87 or 120.3% since purchase.
This sale was my fourth sale of CYTC, having sold 100 shares 3/1/04 at $18.63 (a gain of $3.77 or 25.4%), another 100 shares on 4/2/04 at $22.61 (a gain of $7.75 or 52.3%), and 75 shares on 6/2/04 at $22.79 (a gain of $7.93 or 53.4%). You can see that my disciplined selling at 30, 60, 90, 120% levels was a bit weak. In fact I completely jumped the gun on my third sale which should have been at a 90% appreciation target.
Regardless, with three prior sales I was waiting for a 120% appreciation level, which was indeed reached today, and 1/6th of my remaining position was sold.
Having 17 positions, which being below my maximum of 25 positions, this sale produced a 'permission slip' to add a new position. I have never been good with a nickel in my pocket and turned to the list of top % gainers where I found Angeion (ANGN) a stock that I have looked at in the past. I went ahead and purchased 300 shares of Angeion (ANGN) at $15.09. ANGN actually sold off a little from there closing at $14.73/share.
Thanks so much for stopping by and visiting! If you have any comments or questions, please feel free to leave them on the blog or email me at bobsadviceforstocks@lycos.com.
Bob
Monday, 12 March 2007
Jones Soda (JSDA)
Hello Friends! Thanks so much for stopping by and visiting my blog, Stock Picks Bob's Advice! As always, please remember that I am an amateur investor, so please remember to always consult with your professional investment advisers prior to making any investment decisions based on information on this website.
 Earlier today I reported how I was able, due to a partial sale of my Bolt (BTJ) stock, to get a "permission slip" to add a new holding to my Trading Portfolio. Checking through the list of top % gainers on the NASDAQ, I came across Jones Soda (JSDA) which has been on the list several times the last week and I decided to take a closer look at this company. I liked what I saw and I decided to use this opportunity to add a position in Jones to my portfolio. This morning I purchased 300 shares of Jones (JSDA) at $18.18. JSDA closed at $18.67, up $1.54 or 8.99% on the day today.
I would like to take a brief opportunity to point you in the direction of the factors that led me to make this purchase.
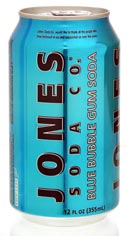 If you review the Yahoo "Profile" on Jones, you will see that this company is a premium beverage producer and distributor. I became familiar with Jones during my visits to my local Panera store where Jones sodas have been stocked.
Last Thursday, on March 8, 2007, Jones announced 4th quarter 2006 results for the quarter ended December 31, 2006. Revenue climbed 15% to $10 million from $8.8 million last year. Earnings jumped 179% to $1.7 million. Net income was up 256% to $2.1 million vs. $.6 million last year and diluted eps were up 167% to $.08/share from $.03/share last year.
Just as important, the company beat estimates of $.01/share on sales of $9.8 million for the quarter.
The Morningstar.com "5-Yr Restated" financials are solid with revenue, after dropping to $19 million in 2002, climbing to $34 million in 2005 and $38 million in the trailing twelve months (TTM). Earnings have been steadily improving from a loss of $(.09) in 2001 to $.13/share in the TTM. The company has increased the # of shares from 19 to 25 million. Free cash flow which was a negative $(1) million in 2004, came in at $1 million in 2005 and $4 million in the TTM.
The balance sheet is solid with total current assets of $42.6 million, compared to the $6.0 million of current liabilities yielding a current ratio of just over 7. No long-term liabilities are reported.
The stock is a small cap stock according to the Yahoo "Key Statistics" with a market capitalization of $474.48 million. It is richly priced with a trailing p/e of 144.73 (!). With the rapid growth, the forward p/e (fye 31-Dec-07) is estimated at 50.46. Still, the PEG works out to a rich 2.58 (5 yr expected). The price/sales is reported at 11.54.
Yahoo shows 25.41 million shares outstanding with 23.28 million that float. As of 2/12/07 there were 4.04 million shares out short representing 17.3% of the float or a significant 6.7 trading days of volume. In the face of good earnings, this sharp rise in the stock price may well represent a squeeze of the short-sellers.
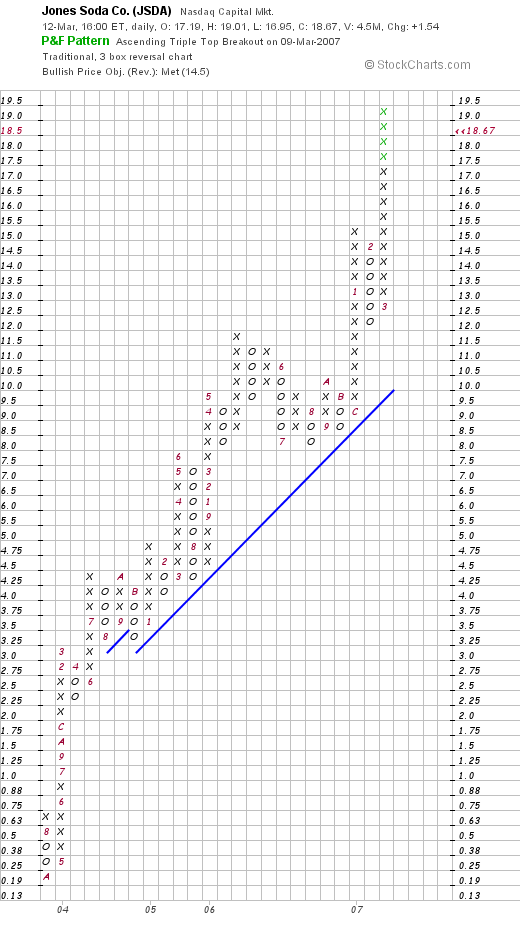
Looking at a "Point & Figure" chart on Jones from StockCharts.com, we can see that the stock has had a very steep rise since mid 2003 climbing from literally $.20/share to a level of $19.00/share in 2007. If anything, the stock appears to be a bit over-extended technically.
To summarize, I purchased shares of Jones Soda (JSDA) earlier today as a result of my partial sale of my Bolt (BTJ) shares. The stock is a very fast growing soft drink producer and is showing very strong price momentum. Earnings have been strong, free cash flow is improving, and the balance sheet is solid. Valuation, however, is priced for perfection with a p/e literally nearly 150. There are lots of short-sellers betting against this company. With any more good news stories, the short-sellers will be squeezed anew and the stock may well rise further. On the other hand.....
Thanks so much for visiting! I just wanted to get a quick note off on this stock tonight before crashing for the evening. If you have any comments or questions, please feel free to leave them on the blog or email me at bobsadviceforstocks@lycos.com.
Bob
Bolt (BTJ) and Jones Soda (JSDA) "Trading Transparency"
Hello Friends! Thanks so much for stopping by and visiting my blog, Stock Picks Bob's Advice. As always please remember that I am an amateur investor, so please remember to consult with your professional investment advisors prior to making any investment decisions based on information on this website.
Earlier this morning I noticed that my stock in Bolt (BTJ) had hit a sale point. In fact it hit the 60% appreciation point and with my targeted appreciation point of 30, 60, 90, 120%, etc., this triggered a sale (which I did manually). I sold 1/6th of my remaining 250 shares or 41 shares at $28.70. These shares were acquired 1/12/07 at a cost basis of $17.44 so this represented an appreciation of $11.26 or 64.6% appreciation.
When will I sell next? On the upside, if the stock hits a 90% appreciation point, or 1.90 x $17.44 = $33.14, then I would be selling 1/6th of my remaining 209 shares of Bolt.
Since I am under my 25 position maximum (currently holding 16 positions) this resulted in a 'permission slip' to add a new position. I saw a new name that seemed to fit the bill and purchased 300 shares of Jones Soda (JSDA) at $18.18. I didn't let that nickel burn a hole in my pocket very long. I always 'kick myself' for not buying any Hansen's (HANS) so maybe I wanted to have another shot at a soft drink manufacturer. Wish me luck.
I have noticed Jones on the top % gainers before today but haven't written it up before. I shall try to get to a review of Jones later today if possible.
Thanks so much for stopping by and visiting! If you have any comments or questions, please feel free to leave them on the blog or email me at bobsadviceforstocks@lycos.com.
Bob
Sunday, 11 March 2007
Quality Systems (QSII) "Weekend Trading Portfolio Analysis"

Hello Friends! Thanks so much for stopping by and visiting my blog, Stock Picks Bob's Advice! As always, please remember that I am an amateur investor, so please remember to consult with your professional investment advisers prior to making any investment decisions based on information on this website.
I try to accomplish several things at one time on this blog. My main goal is to see if I can enhance my own ability and skills at 'picking stocks' that might lead to future price appreciation. I do this with the many 'stock picks' that I write about on this website. As I just did, I try each weekend to review my past stock picks, find out how they turned out, and try to determine if there is anything else I could have done to help identify further stocks of interest.
In addition to my 'generic' review, I also manage an actual Trading Portfolio. I now have 16 stocks and when I trade them I try very hard to remember to quickly post a note that I call "trading transparency" to keep you, the reader, informed of what I am actually doing in real life. Sometimes my trades make me look smart, other times I am taking losses as I just recently did with my WOOF stock.
As I manage my portfolio, I continue to develop my own peculiar trading rules. And again, this is something that I write about frequently on the blog. The 'when to buy' and the 'when to sell' thinking. And how I use these sales on either 'good news' or 'bad news' to direct me in how I manage my overall portfolio 'posture'. The discipline of having rules has been quite helpful to me and the fact that I am now responsible to you, the reader, has kept me sticking to these rules. I cannot tell you how many times I have felt like selling a stock when the market was gloomy, or when I wanted just to buy something and held back (even when I bought Kendle outside of the rules, this resulted in a loss and was another tough pill for me to swallow---but I shared even these moments when I strayed from the rules with you!).
Anyhow, as part of my weekend 'homework' around here, I have been trying on intervals to go through my actual trading portfolio and give myself as well as all of you an update on my actual holdings.
After my sale of WOOF, I am back to 16 positions. My maximum remains 25, and my minimum is 6. I shall not go above 25 or below 6. When I sell a stock at a gain and hold 25, proceeds will go to cash. And when I sell one of the last 6 at a loss, instead of 'sitting on my hands' I plan on re-investing in a new position, if I ever get to that point. Every couple of weeks or so, I have been reviewing my portfolio, going alphabetically through my list of holdings. Last month, on February 17, 2007, I reviewed Precision Castparts (PCP) on Stock Picks Bob's Advice. Going alphabetically, I am up to Quality Systems (QSII), one of my most successful investments since I started utilizing my current strategy and writing my blog.
Currently I own 88 shares of Quality Systems (QSII) which I purchased with a cost basis of $7.75 on July 28, 2003. QSII closed at $39.05 on March 9, 2007, for an unrealized gain of $31.30 or 403.9% since my purchase. I have now sold portions of Quality Systems nine times, representing partial sales at 30, 60, 90, 120, 180, 240, 300, 360, and 450% appreciation levels. Thus, on the upside, my next partial sale which would be 88 x 1/6 = 14 shares, would be at a 540% appreciation or 6.4 x $7.75 = $49.60. On the downside, having already sold a portion at a 450% gain, I would sell all remaining shares if the stock should decline to 1/2 of that level or to a 225% gain, which calculated works out to 3.25 x $7.75 = $25.19.
I first reviewed Quality Systems on Stock Picks Bob's Advice on July 28, 2003, when it was trading at $30.67. Adjusted for two 2:1 stock splits, that works out to a pick price of $7.67. Let's take another look at Quality Systems (QSII) and see if it still deserves a big 'thumbs up' on this blog!
 What exactly does this company do?
According to the Yahoo "Profile" on QSII, the company
"...and its subsidiary NextGen Healthcare Information Systems, Inc. engage in the development and marketing of healthcare information systems that automate medical and dental practices, physician hospital organizations and management service organizations, ambulatory care centers, community health centers, and medical and dental schools. It offers proprietary electronic medical records software and practice management systems under the NextGen3 product name."
How did they do in the latest quarter?
On February 5, 2007, Quality Systems (QSII) announced 3rd quarter 2007 results. For the quarter ended December 31, 2006, net revenues came in at $38.5 million, up 44% from the $26.8 million in the same quarter the prior year. Net income was $8.7 million, up 81% over the net income of $4.8 million reported last year. Fully diluted eps came in at $.32/share, up 78% over the $.18/share reported last year.
Within the report was a pertinent comment about the fact that the SEC was examining the Chief Financial Officer's trading record. The company beat expectations on earnings which were expected at $.30/share, and came in slightly light on revenue, which had been estimated by analysts at $39 million.
How about longer-term results?
If we review the Morningstar.com "5-Yr Restated" financials, we see a very pretty picture. Revenue, which was $44 million in 2002, has steadily increased to $119 million in 2006 and $148 million in the trailing twelve months (TTM).
Earnings, which were $.21/share in 2002, have steadily increased, quadrupling to $.85/share in 2006 and quintupling to $1.17/share in the TTM.
The company even initiated dividends in 2005, paying $.75/share, and increased it to $.88/share in 2006. Meanwhile, the shares have been relatively stable, increasing from 24 million in 2002 to 27 million, a little over a 10% increase in the shares outstanding while revenue was up over 200%, and earnings were up over 400%. I can handle this level of dilution!
Free cash flow has been essentially positive and growing with $16 million in 2004, $20 million in 2005, $28 million in 2006, and a slight dip to $26 million in the TTM.
The balance sheet is solid with $80.4 million in cash, which by itself can easily cover the $54.8 million in current liabilities and the $2.8 million in long-term liabilities combined with literally millions left over. Calculating the current ratio, when comparing the total current assets of $147.4 million to the $54.8 million in current liabilities, we find a solid ratio of 2.69.
What about some valuation numbers?
Checking the Yahoo "Key Statistics" on Quality Systems we find that this stock is a small mid cap stock with a market capitalization of $1.05 billion. (The definition of mid cap stocks vary, but this one suggests a market capitalization of $1 billion to $5 billion). The p/e is a bit rich at 33.21, but the forward p/e is 25.89 (fye 31-Mar-08 estimated). Thus, with the rapid growth, as reported even in the latest report above, the PEG (5 yr expected) works out to a very reasonable .97. (1.0 to 1.5 is acceptable to me.)
Checking the Fidelity.com eresearch website, we find that relative to the Price/Sales (TTM), this stock is richly valued with a Price/Sales (TTM) of 7.11, compared to an industry average of 5.31. However, the company is far more profitable than the average of its group, when measured by the Return on Equity (TTM). ROE for QSII works out to a 36.50%, compared to the industry average of 19.01%.
Finishing up with Yahoo, we find that there are 26.98 million shares outstanding with 17 million that float. Currently, as of 2/12/07, there are 4.33 million shares out short representing 25.20% of the float or 10 trading days of volume. Using my own 3 day rule for significance, this looks to be a lot of shares that have already been sold betting on some bad news, most likely related to the CFO investigation reported by the company. If the company, however, comes in with good news instead, there is likely to be a lot of buying pressure as these short-sellers scramble for the exits, rushing to buy shares to close out their short positions.
As noted the company is paying a trailing dividend of $1.00, yielding 2.6%. The last stock split was a 2:1 split on March 27, 2006.
What does the chart look like?
Looking at a "Point & Figure" chart on QSII from StockCharts.com, we can see the incredible strength shown in this chart. Recently under a little bit of pressure from the cloud hanging over the company from the possible SEC investigation of the CFO, the stock still remains well above its support level. I have included the points at which I have made my partial sales of this stock as it hit my appreciation targets.
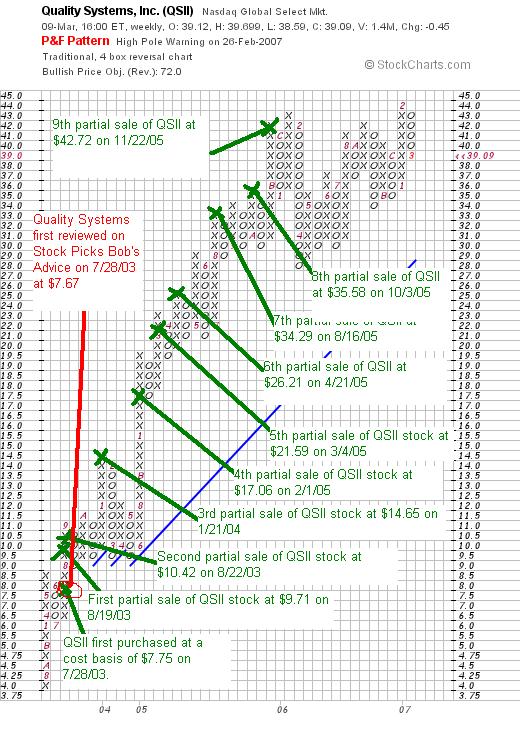
All of these sales may seem a little odd, but they are the result of a disciplined strategy of selling gaining stocks slowly and partially as they hit appreciation targets set at the time of purchase.
Summary: What do I think?
Well, this is a fabulous stock. Of course, I own shares so please take that into consideration. I suspect the CFO news is a non-story but I have no information on this and this is something that should be taken into consideration. The latest quarter was fabulous. I love the electronic medical record field as healthcare facilities are all moving from paper to paperless records. I also own some shares in Cerner which is another company in this field. The Morningstar.com report is beautiful, and the valuation is nice with a PEG under 1.0, a ROE that is higher than its peers but the Price/Sales is indeed a bit rich.
In summary:
I STILL RATE QUALITY SYSTEMS AS A BUY.
Thanks so much for stopping by and visiting my blog! Please remember that I am an amateur and that past performance of any stock or even any investor (!) is no indication of future success. If you have any comments or questions, please feel free to leave them on the blog or email me at bobsadviceforstocks@lycos.com. If you get a chance, be sure and visit my Stock Picks Podcast Website. If I get a chance :), then maybe I will be able to post another podcast later this week.
Bob
"Looking Back One Year" A review of stock picks from the week of October 24, 2005

Hello Friends! Thanks so much for stopping by and visiting my blog, Stock Picks Bob's Advice! As always, please remember that I am an amateur investor, so please remember to consult with your professional investment advisers prior to making any investment decisions based on information on this website.
The weekend is almost over :( and I haven't yet written up my review! I don't want to get another week behind! I have had a few questions about 'how come you say looking back ONE year and it is almost like a year-and-a-half?' Needless to say, the answer is unfortunately self-explanatory. I get busy. One thing leads to another and YIKES I don't get to the write-up. (When I tell you I am an AMATEUR blogger...I am not kidding!)
But seriously, these 'weekend reviews' help me and help you assess the usefulness of what I write on this website. In addition, hopefully we can learn from which of these picks worked and which didn't.
As I have pointed out elsewhere, these reviews also depend on a 'buy and hold' approach to investing, which assumes that an investor actually bought all of the stocks discussed on the blog that week, investing equal dollar amounts, and let the investment sit. In practice, I employ and advocate on this blog a disciplined approach to investing that is quite different that this 'buy and hold' system. I use the 'buy and hold' approach for this review frankly because it is a retrospective look at stocks and it is simpler to assume I bought and held than determining the effect of a portfolio management system on the results. However, the difference in the investment strategy would certainly affect final results---hopefully, but not necessarily, for the good.
 On October 24, 2005, I 'revisited' K-Swiss (KSWS) which was, at that time, trading at $32.71/share. KSWS closed at $28.20 on March 9, 2007, for a loss of $(4.51) or (13.8)%.
 On February 22, K-Swiss reported 4th quarter 2006 results. Revenues for the quarter ended December 31, 2006, increased 1.7% to $93.8 million, compared with $92.3 million in the same quarter the prior year. Net earnings, however, decreased to $10.7 million or $.30/diluted share, down from $11.6 million or $.33/diluted share the prior year.
The company also offered what I would view as discouraging guidance for 2007:
"The Company's estimates for the first quarter of 2007 and full-year 2007 reflect a significant decline in domestic revenues; substantial investments in product development and marketing for the K-Swiss brand, including a retail strategy; continued expansion of international operations; and continued investment in the Royal Elastics brand. The estimates are based upon the following assumptions: domestic revenues will decline approximately 30% for the year; gross margins will be approximately 46%; SG&A will not rise above $40 million for the first quarter of 2007 or $152 million for the full-year 2007; our tax rate will approximate 20%; customer order cancellations will be moderate; and the Company's growth initiatives with respect to Royal Elastics will not exceed a net loss of $0.11 per share for the full year."
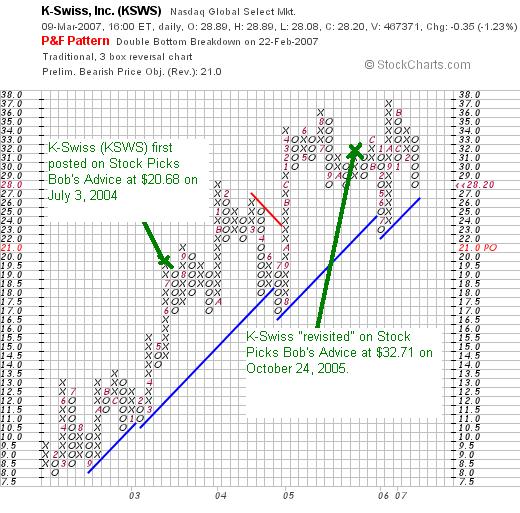
From this perspective,
K-SWISS IS RATED A SELL.

On October 24, 2005, I "revisited" Simpson Manufacturing (SSD) on Stock Picks Bob's Advice when the stock was trading at $38.01. SSD closed at $31.11 on March 9, 2007, for a loss of $(6.90) or (18.2)%.
On February 1, 2007, Simpson announced 4th quarter 2006 results. For the quarter ended December 31, 2006, net sales decreased 11.9% to $179.6 million as compared to net sales of $203.9 million for the same quarter in the prior year. Net income declined 13.4% to $18.7 million in the 2006 final quarter compared to $21.6 million in the same quarter in 2005. On a diluted per common share basis this worked out to $.38/share in 2006 down from $.44/share in the fourth quarter of 2005.
The company failed to meet expectations. Analysts had been expecting earnings of $.40/share on revenue of $189 million. Simpson missed on both counts.
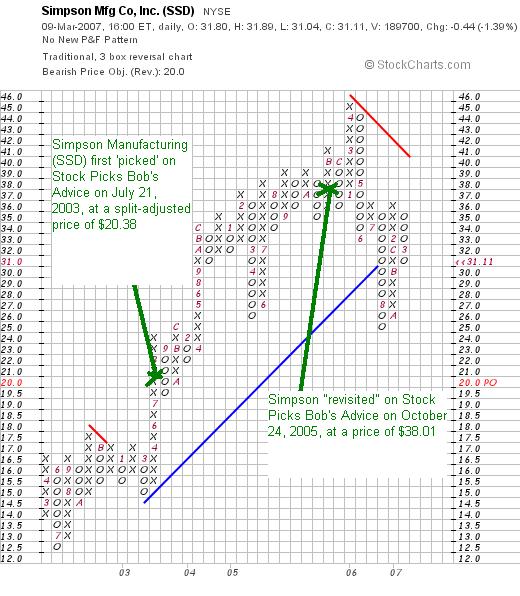
Due to the poor earnings results, failing to meet expectations on both revenue and earnings, and the poor technical appearance of the chart,
SIMPSON (SSD) IS RATED A SELL.

On October 25, 2005, I posted Rimage (RIMG) on Stock Picks Bob's Advice when the stock was trading at $28.62. RIMG closed at $26.30 for a loss of $(2.32) or (8.1)% since posting.
 On February 26, 2007, Rimage (RIMG) announced 4th quarter 2006 results. For the quarter ended December 31, 2006, revenue came in at $30.5 million, up 26% from $24.3 million in the same quarter in 2005. Net income increased 57% to $3.6 million or $.34/diluted share, up from $2.3 million or $.22/diluted share in the same quarter the prior year. These results exceeded the company's own previous guidance.
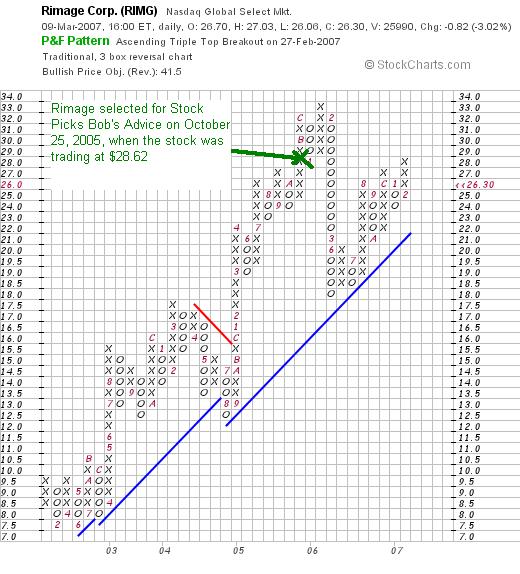
With the outstanding earnings report, the great "point & figure chart" from StockCharts.com, even though I am showing a loss on this stock the RIMAGE IS STILL RATED A BUY.

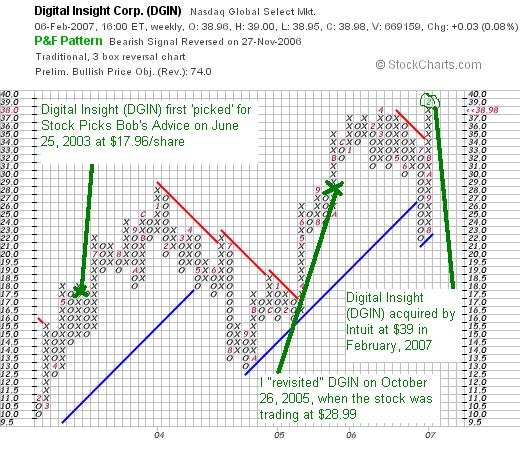
On October 26, 2005, I "revisited" Digital Insight (DGIN), when the stock was trading at $28.99. On December 1, 2006, it was announced that Intuit would acquire Digital Insight for $1.35 billion or $39.00/share. This worked out to a gain of $10.01 or 34.5% since posting.

On October 27, 2005, I "revisited" ASV (ASVI) on Stock Picks Bob's Advice when the stock was trading at $23.02. ASVI closed at $15.19 on March 9, 2007, for a loss of $(7.83) or (34)% since posting.
On March 7, 2007, ASVI announced 4th quarter 2006 results. For the quarter ended December 31, 2006, sales declined to $46.1 million from $66.0 million in the same period a year earlier. Net earnings were down even more sharply at $2.4 million compared with $8.2 million, or $.09/diluted share vs. $.29/diluted share in the 4th quarter 2005.
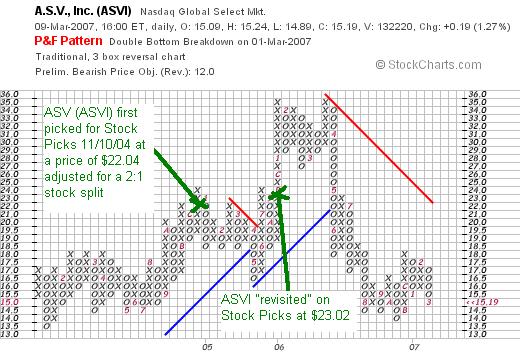
With the weak earnings report and the weak technical appearance of the "point & figure" chart from StockCharts.com, I would have to say that
ASV INCORPORATED (ASVI) IS RATED A SELL.
 The last stock I discussed that week was Micros (MCRS) which I posted on Stock Picks Bob's Advice on October 28, 2005, when the stock was trading at $45.82. MCRS closed at $54.18 on March 9, 2007, for a gain of $8.36 or 18.2% since posting.
On January 25, 2007, Micros (MCRS) announced 2nd quarter 2007 results. Revenue increased 15.8% to $189.9 million from $164 million in the same quarter the prior year. Net earnings were $18 million, up from $14.2 million or $.44/share, up from $.35/share in the same period last year.
The company beat revenue expectations of $188 million, but, if stock-based compensation expenses are included, missed earnings expectations of $.48/share. However, without these one-time expenses (I am not sure whether analyst expectations included these or not), earnings would have also beaten expectations at $.49/share.
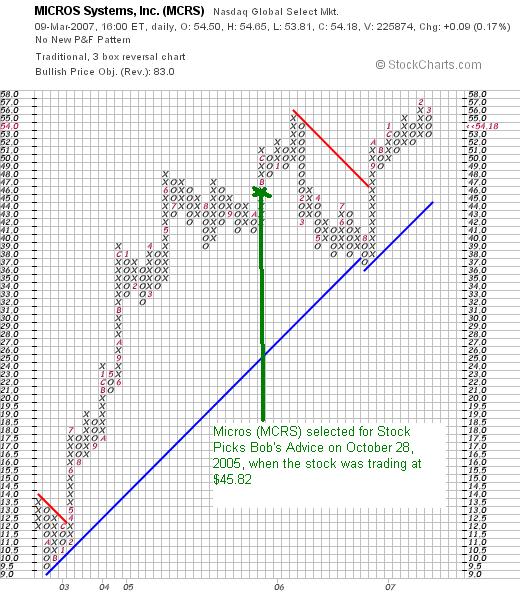
In light of the outstanding earnings report and the nice technical appearance of the "point & figure" chart on MCRS from StockCharts.com,
MICROS IS RATED A BUY.
So how did I do during this week in October, 2005? Pretty mediocre. I had an average loss of (3.6)% for the week's picks with four stocks showing declines after I picked them and two showing gains.
Thanks so much for stopping by and visiting my blog! If you have any comments or questions, please feel free to leave them on the blog or email me at bobsadviceforstocks@lycos.com. If you get a chance, be sure and visit my Stock Picks Podcast Website.
Bob
Newer | Latest | Older


