Stock Picks Bob's Advice
Thursday, 27 October 2005
"Revisiting a Stock Pick" ASV (ASVI)
Hello Friends! Thanks so much for stopping by and visiting my blog,
Stock Picks Bob's Advice. As always, please remember that I am an amateur investor, so please consult with your professional investment advisors prior to making any investment decisions based on information on this website.

The market is weak this morning. However, that doesn't mean we cannot find stocks that might eventually be worth investing money in! But it does mean, that we should exercise caution adding money to our portfolio in the midst of corrections. Better to buy on the way up imho.
Looking through the
list of top % gainers on the NASDAQ today, I came across A.S.V., Inc. (ASVI), which as I write is trading at $23.02, up $3.10 or 15.56% on the day. I have owned shares of ASV in a managed account (that I am not consulted about) but I believe those shares have been sold and I am not currently a shareholder. (You can see how closely I follow
that account!).
According to the
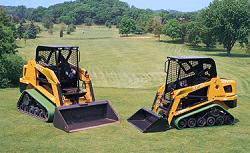
Yahoo "Profile" on ASVI, the company "...engages in the design, manufacture, and sale of track-driven all-season vehicles."

I first
posted ASVI on Stock Picks Bob's Advice just about a year ago, on November 10, 2004, when the stock was trading at $44.07. The stock split 2:1 on 8/25/05, resulting in our "pick price" actually being $22.04. Thus, the stock is only currently trading $.98 ahead of our pick price last year or ahead by 4.4%. This pick certainly has not gotten away from us!
Earnings are one of the major determinants of stock prices both short-term and long-term imho. And it is not surprising to me that what drove the stock higher was the release of
3rd quarter 2005 results this morning just before the opening of trading.
For the quarter ended September 30, 2005, sales increased 70% (!) to $69.2 million from $40.6 million in the same period last year. Net earnings were also up sharply with $8.0 million reported vs. $4.4 million reported in the same period the prior year. On a diluted per share basis, earnings came in at $.29/share, a 71% increase from $.17/share last year same period. In addition, to top it off, for the so called icing on the cake, the company
raised guidance on both sales and earnings for the full year.
How about longer-term? Looking at the
Morningstar.com "5-Yr Restated" financials, we can see a steady rate of sales between 2000 when $43.9 million was reported and 2002 when $44.2 million was noted. However, since then there has been a steady and strong growth in revenue to $198.6 million reported in the trailing twelve months (TTM).
Earnings have followed a similar pattern with $.08/share reported in 2000 dropping to $.07/share in 2002. Again, since 2002, there has been a sharp rise in earnings to $.78 reported/share in the TTM.
Free cash flow isn't quite as nice, with $0 reported in 2002, dropping to $(8) million in the TTM. With everything else in line, I have chosen to overlook this free cash flow number. As you probably know, all things being the same, I much prefer to see strong and steady growth in free cash flow in the stocks I "pick".

The balance sheet, as reported by Morningstar, looks fabulous allowing me to justify overlooking the latest twelve month
negative free cash flow. The company is reported to have $25.6 million in cash, enough to cover both the $20.6 million in current liabilities
and the $2.5 million in long-term liabilities combined. In addition, the company is reported to have a substantial $91.6 million in other current assets.
Looking at
Yahoo "Key Statistics" on ASVI, we can see that this is a small cap stock with a market capitalization of only $615.23 million. The trailing p/e isn't too bad at 29.52, with a forward (fye 31-Dec-06) p/e of 20.64. With the nice growth, and I don't believe this statistic has been adjusted for today's numbers, the PEG is still a reasonable 1.14. I suspect the PEG is likely to be under 1.0 in light of the superb report today.
Using
Fidelity.com eresearch website, to try to get a handle on valuation in terms of the price/sales figure (I like to compare, a la Paul Sturm, the price/sales numbers to other companies in the same industrial grouping), we find that ASVI is tops in the group "Farm/Construction Machinery" with a price/sales ratio of 2.8. Following ASV is Joy Global (JOYG) at 2.1, Caterpillar (CAT) at 1.1, Deere (DE) at 0.7, AGCO (AG) at 0.3 and CNH Global (CNH) at 0.3. Certainly from this particular perspective, ASVI is not a screaming bargain!
Returning to Yahoo for some additional parameters, we note that there are only 26.85 million shares outstanding. Currently, 2.96 million are out short, which is 16.50% of the float! This amounts to 10.1 trading days of volume. Using my own 3 day rule, this appears quite significant, and we may be seeing a bit of a short squeeze as all of these short-sellers may be rushing to cover on this relatively lightly traded stock!
No cash dividend is paid, and as I noted earlier, the company did split its stock on August 25, 2005.
What about a chart? Looking at a
"Point & Figure" chart on ASVI from Stockcharts.com:
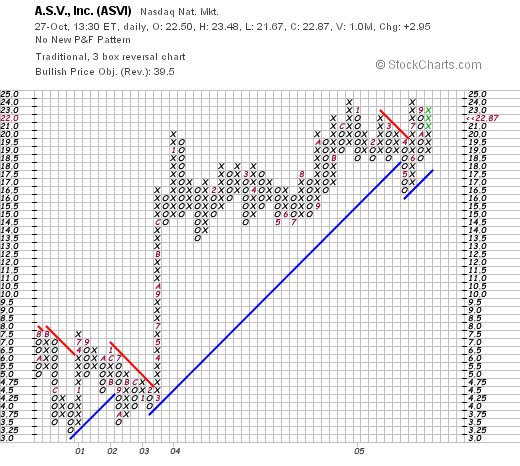
We can see that the stock traded sideways between 2000 and early 2003 when, as we have noted, the company also performed in a relatively 'flat' fashion. In early 2003, the stock climbed from $4.00/share in March, 2003, to $20/share in January, 2004. Since then, the stock has traded basically sideways, has developed new support levels at this price point, and appears to be poised for another upward move assuming it can get through about $24 on the upside imho. The chart looks fine to me!
So what do I think? Well, the latest quarterly report was absolutely superb. The revenue was great, the earnings were strong, and guidance was revised higher! In addition, except for a period between 2000 and 2002, the company has been growing its revenue and earnings steadily and in a strong fashion. In addition, the balance sheet looks great.
On a negative, the free cash flow is negative, the price/sales is a bit rich, although the p/e isn't bad and I suspect that the PEG would also be close to or under 1.0 if estimates took into consideration the current quarter. The chart looks fine to me as well.
Thus, if I were in the market to buy some shares, this stock, especially with that latest quarterly report, might well be on my short list. But meanwhile, I shall be sitting on my hands, trying to wait out this correction, awaiting either additional sales as my stocks decline or perhaps a purchase, if prices can turn around and I can get a buy signal with a sale of a portion of one of my holdings at a gain!
Thanks so much for stopping by. If you have any questions or comments, please feel free to leave them on the blog or email me at bobsadviceforstocks@lycos.com.
Bob
Wednesday, 26 October 2005
"Revisiting a Stock Pick" Digital Insight (DGIN)
Hello Friends! Thanks so much for stopping by and visiting my blog,
Stock Picks Bob's Advice. As always, please remember that I am an amateur investor, so please remember to consult with your professional investment advisors prior to making any investment decisions based on information on this website.

I was looking through the
list of top % gainers on the NASDAQ this morning, and noticed that Digital Insight (DGIN) had made the list. As I write, DGIN is trading at $28.99/share, up $2.07 or 7.69% on the day. I do not own any shares of DGIN nor do I own any options on this stock.
I first
posted DGIN on Stock Picks Bob's Advice on June 25, 2003, when it was trading at $17.96/share. Thus, we have a 'gain' on this selection of $11.03 or 61.4% since I first posted this stock almost 2 1/2 years ago!
According to the
Yahoo "Profile" on Digital Insight, the company "...provides outsourced online banking applications and services to banks, credit unions, and savings and loan associations."
As we often see around here, what drove the stock higher today, was the announcement after the close of trading yesterday of
3rd quarter 2005 earnings results. For the quarter ended September 30, 2005, revenues increased 12% to $53.2 million from $47.5 million for the same quarter last year. Net income for the quarter climbed 65% (using GAAP...generally accepted accounting practices as the news story states), to $6.8 million or $.19/diluted share, up from $4.1 million or $.12/diluted share the prior year. In addition, at least according to the headline of the article, the company increased 2005 eps guidance. I don't see any details on this guidance change within the article itself.
How about longer-term results? Looking at the
"5-Yr Restated" financials from Morningstar.com we can see a very pretty picture of sustained revenue growth from $54.4 million in 2000 to $200.4 million in the trailing twelve months (TTM).
Earnings-wise, the company was losing money at $(2.35)/share in 2000, turned profitable in 2003 at $1.38, dropped to $.47/share in 2004 and has increased to $.57/share in the TTM. Hopefully, this inconsistent earnings picture, not very unusual in these small companies, will change into a more steady picture of both revenue and earnings growth.
According to Morningstar.com, free cash flow has been postive and steadily increasing the past few years with $11 million reported in 2002 increasing to $40 million in the TTM.
The balance sheet is also very solid with $82.2 million in cash, enough to pay off both the $43.4 million in current liabilities and the $7.4 million in long-term liabilities combined almost twice over. In addition, the company has $53.1 million in other current assets per Morningstar.
Looking for some valuation parameters from
Yahoo "Key Statistics" on DGIN, we can see that this company is a smallish mid cap stock with a market capitalization of $987.94 million. The trailing p/e is a bit rich at 51.35, and the forward p/e (fye 31-Dec-06) is a tad better at 29.60. The PEG also suggests a rather rich valuation with a 1.78 statistic.
Looking at the
Fidelity.com eresearch website for DGIN, we find that the company has been assigned to the "Consumer Services" industrial group, and within this group DGIN tops out the list with a Price/Sales ratio of 4.8. This is followed by 4Kids Entertainment (KDE) at 2.4, Chemed (CHE) at 1.3, Ace Cash Express (AACE) at 1.1, and Central Parking (CPC) at 0.5. I am not sure that these particular companies are necessarily a good comparison for DGIN, but that is the grouping by Fidelity!
Looking for some additional numbers from Yahoo, the company has 34.06 million shares outstanding. Currently, there are 1.53 million shares out short, representing 5% of the float or 4.2 trading days of volume (the short ratio). Thus, using my 3 day rule, this is a bit of a factor supporting the stock price, especially with the good news on earnings released.
No cash dividend, and no stock dividends are reported by Yahoo.
What about a chart? Taking a look at the
"Point & Figure" chart from Stockcharts.com on DGIN:
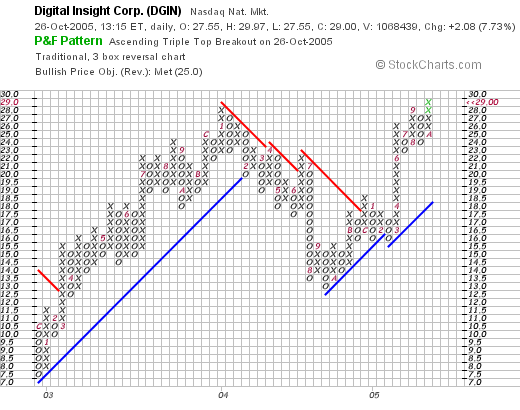
We can see that the stock was moving ahead steadily December, 2003, when it was trading at around $7.00/share to an intermediate top around $28 in January, 2004. The stock subsequently declined to $13 level in September, 2004, and has been trading higher once again, exceeding its prior high price with the current level of around $29. It is interesting to see the tracking between the decline in earnings in 2004 to the sell-off in the stock price, and once again, as earnings resume their rise, the stock moves ahead with the news!
So what do I think? Well, I find the entire field of internet banking intriguing. Apparently this stock is in the middle of this phenomenon. The latest earnings were great, the five year Morningstar view on revenue growth was great, the free cash flow is nice, the balance sheet is solid, and the chart looks encouraging.
However, on the downside, the p/e is certainly rich at just over 50, the PEG is also high just under 2.0, and the Price/Sales is at the tops of its particular (?) industrial group. Thus, I am not the first to discover this stock :(. However, the opportunity still looks attractive, and as long as the company continues to grow earnings and revenue at the nice clip it is currently doing, well, valuation might even start coming into line!
Thanks so much for stopping by! I hope you find my chatter informative; please do let me know what you think of what I write! If you have any conmments or questions, please feel free to leave them right on the blog or email me at bobsadviceforstocks@lycos.com.
Bob
Tuesday, 25 October 2005
October 25, 2005 Rimage (RIMG)
Hello Friends! Thanks so much for stopping by and visiting my blog,
Stock Picks Bob's Advice. As always, please remember that I am an amateur investor so please remember to consult with your professional investment advisors prior to making any investment decisions based on information on this website.

Looking through the
list of top % gainers on the NASDAQ today, I came across Rimage (RIMG) which closed at $28.62, up $2.42 or 9.24% on the day even though the overall market was relatively anemic. I do not own any shares of this company nor do I own any options.
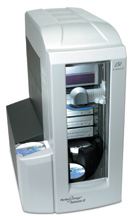
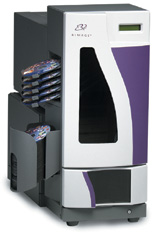
According to the
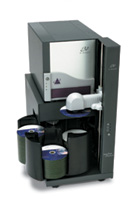
Yahoo "Profile" on Rimage, the company "...engages in the development, manufacture, and distribution of CD-Recordable (CD-R) and DVD-Recordable (DVD-R) publishing and duplication systems."
What drove the stock higher today, was the release of
3rd quarter 2005 earnings results shortly before the start of trading this morning. For the quarter ended September 30, 2005, revenue grew 56% to $28.0 million from $17.9 million in the same period in 2004. Net income was up 94% to $4.09 million from $2.11 million last year, and income per diluted share was up sharply to $.39/share, up from $.21/share last year same period.
Looking longer-term at the
Morningstar.com "5-Yr Restated" financials, we can see that the company did have a dip in revenue from $49.8 million in 2000 to $38.9 million in 2001. However, since that time, there has been a steady growth in revenue to $82 million in the trailing twelve months (TTM).
Likewise, earnings dipped to $.51/share in 2001 from $.85/share in 2000. However, since then earnings have steadily grown to the $1.01/share in the TTM.
Free cash flow, while erratic, has remained positive fluctuating from $8 million in 2002 to $5 million in the TTM.
Looking at the balance sheet, as reported by Morningstar, the company has $56.1 million in cash, more than enough to cover the combined $11.6 million in current liabilities and the $.1 million in long-term debt, more than 4x over. In addition, the company has an additional $21 million of other current assets beyond the cash already discussed.
Checking
Yahoo "Key Statistics" on RIMG, we find that this company is almost too small to be considered a small cap stock (under $250 million in market capitalization may be considered a "micro" cap stock) with a market capitalization of only $272.86 million. The trailing p/e isn't too bad at 28.20 and the forward p/e (fye 31-Dec-06) is nicer at 21.52. Thus, with the quick growth estimated, the PEG comes in at only 1.14.
Using the
Fidelity.com research on RIMG, we can see that this stock is in the "Computer Peripherals" industrial group. Within this group, the company is moderately priced relative to its Price/Sales ratio.
Topping the list of companies in this group is Foundry Networks (FDRY) with a Price/Sales ratio of 4.6. Emulex (ELX) is next at 4.5, and Secure Computing follows with a ratio of 4.5 as well. Rimage (RIMG) is below this at 3.3, Nice Systems (NICE) at 3.1, and at the bottom of this group is Lexmark (LXK) with a Price/Sales ratio of only 1.0.
Going back to Yahoo for some additional 'numbers' on the stock, we can see that there are only 9.53 million shares outstanding. As of 9/12/05, 2.20% of the float was out short amounting to 7.6 trading days of volume (short ratio). This appears significant, even though this is only actually 194,680 shares out short.
No cash dividend is paid and the last stock split was a 3:2 split on April 10, 2000.
What about a chart? Looking at a
"Point & Figure" chart on RIMG from Stockcharts.com:
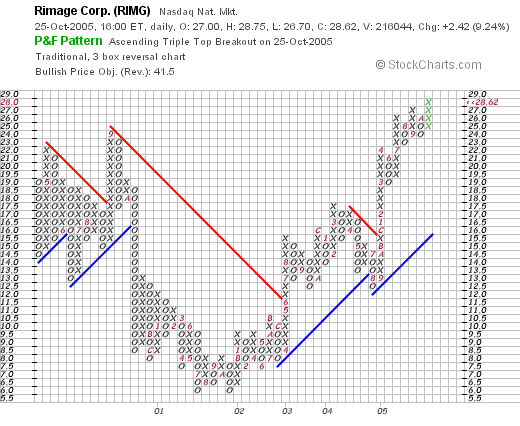
We can really see the big change in the company's fortunes from its declining stock price from $26-$28 in April, 2000, to its bottom at around $6 in July, 2001. Since that time the company and the stock turned around rising strongly to its current level of around $28/share.
So what do I think? The earnings report today was fabulous! The Morningstar write-up is impressive with steady five-year growth in both revenue and earnings, nice free cash flow, a solid balance sheet, and reasonable valuation. On top of this the chart looks very strong as well! Now, if only I were in the market to be buying a stock :(. But I shall be sitting on my hands until such time as a sale in one of my stocks on "good news" entitles me to add a position!
Thanks again for stopping by. If you have any comments or questions, please feel free to leave them on the blog or email me at bobsadviceforstocks@lycos.com.
Bob
"Trading Transparency" Alliance Data Systems (ADS)
Hello Friends! Thanks so much for stopping by and visiting my blog,
Stock Picks Bob's Advice. As always, please remember that I am an amateur investor, so please consult with your professional investment advisors prior to making any investment decisions based on information on this website.
I was checking my portfolio today and realized that my Alliance Data Systems (ADS) had hit an 8% loss, and thus was sold from my portfolio. A few minutes ago, I sold my 200 shares of ADS at $35.68. I purchased these shares 6/16/05 at $39.10. Thus, I had a los of $(3.42) or (8.7)% since my purchase.
What do I do now? As per my previously stated strategy, when I sell a stock within my portfolio at a loss, I consider this "bad news" and thus do nothing, or as I like to say, I "sit on my hands". I still have a significant, if shrinking, margin balance, and I shall use the proceeds to pay this down. I am waiting for "good news", that is a sale of a portion of one of my holdings at a gain, prior to adding a position. I am now down to 20 positions in my stated goal of 25 positions in my portfolio.
How low would I go in shrinking my positions? I plan, if necessary, to drop down to a minimum level of 6 positions. Consider half a portfolio (12 positions) at neutral, 25 positions at "fully invested" and 6 positions at "minimally invested."
I hope this discussion is helpful to you! If you have any comments, or questions, please feel free to leave your comments right here on the blog or you can email me at bobsadviceforstocks@lycos.com.
Bob
Monday, 24 October 2005
"Revisiting a Stock Pick" Simpson Manufacturing (SSD)
Hello Friends! Thanks so much for stopping by and visiting my blog,
Stock Picks Bob's Advice. As always, please remember that I am an amateur investor and you should always remember to consult with your professional investment advisors prior to making any investment decisions based on information on this website.

After a real strong day in the market, I figured I probably could find one more stock to discuss on the blog! Looking through the
list of top % gainers on the NYSE today, I came across Simpson Manufacturing Co. (SSD) which closed at $38.01, up $2.12 or 5.91% on the day. I do not own any shares of Simpson nor do I own any options.
Simpson was an early "stock pick" of mine, having
selected Simpson for Stock Picks Bob's Advice on 7/21/03 when the stock was listed as trading at $40.75. Simpson split its shares 2:1 on November 19, 2004, making my stock pick price actually only $20.38. With today's close at $38.01, this makes the price appreciation actually $17.63 or 86.5% since posting!
According to the
Yahoo "Profile" on Simpson, the company "...through its subsidiaries, Simpson Strong-Tie Company, Inc. and Simpson Dura-Vent Company, Incl, engages in designing, engineering, and manufacturing wood-to-wood, wood-to-concrete, and wood-to-masonry connectors, as well as screw fastening systems and collated screws, prefabricated shear walls, and venting systems for gas and wood burning appliances."
On July 26, 2005, Simpson
announced 2nd quarter 2005 results. For the quarter ended June 30, 2005, net sales increased 23.4% to $224.3 million, up from $181.8 million in the same quarter last year. Net income climbed 32.2% to $28.8 million compared to $21.8 million in net income for the prior year same period. Diluted EPS was reported at $.60/share, up 33% from $.45/share for the same quarter in 2004.
And what about longer-term results? Looking at the Morningstar.com
"5-Yr Restated" financials, we can see that revenue has steadily grown from $369.1 million in 2000 to $764.9 million in the trailing twelve months (TTM).
Earnings have also steadily increased during this period from $.80/share in 2000 to $1.79/share in the TTM. Free cash flow has been a tad erratic increasing from $22 million in 2002 to $50 million in 2003, then dropping to $(23) million in 2004, but improving to $24 million in the TTM.
The company initiated a dividend of $.15/share in 2004 and has paid $.20/share in the TTM.
Looking at the balance sheet, as reported by Morningstar.com, we see that the company has $63.0 million in cash and $334.9 million in other current assets, which is about a coverage of four times the $95.3 million in current liabilities and the $3.3 million in long-term liabilities combined.
What about some valuation parameters? Looking at
Yahoo "Key Statistics" on Simpson Manufacturing, we can see that the company is a mid-cap stock with a market capitalization of $1.83 billion. The trailing p/e isn't bad at 21.25, and the forward p/e is a bit better at 16.45. The PEG is a moderate 1.21.
Looking at the Price/Sales ratio relative to
other stocks in the industrial group of "Small Tools & Accessories", we can see that Simpson (SSD) leads the group in Price/Sales valuation at 2.3. This is vfollowed by Stanley Works (SWK) at 1.3, Black & Decker (BDK) at 1.0, Snap-On (SNA) at 0.9, and Toro (TTC) at 0.9. Thus the stock looks to be fully valued in the context of other companies in the same industrial group.

Going back to Yahoo for some more statistics, we find that there are 48.02 million shares outstanding, with 2.15 million shares as of 9/12/05 or 5.90% of the float out short, representing 14.4 trading days of volume. Using my own 3 day rule of short-interest volume, this appears to be quite significant, and may be driving this stock higher with a bit of a "squeeze" on the short sellers.
As noted above, the company does pay a $.20/share dividend yielding 0.60%. The last stock split, as already discussed, was a 2:1 split on 11/19/04.
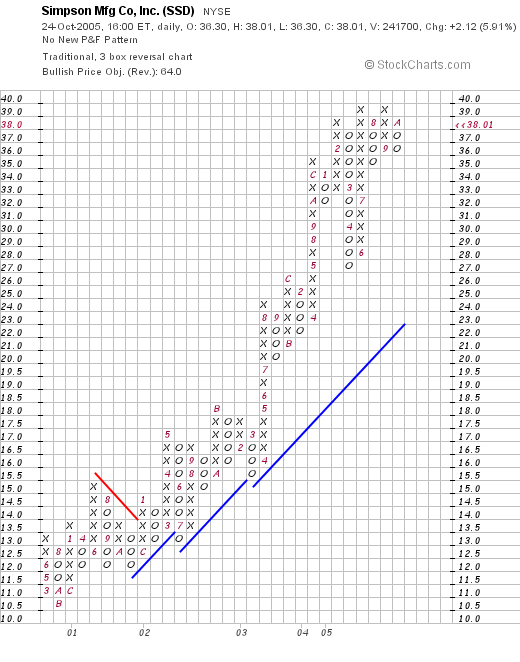
And what about a chart? Looking at a
"Point & Figure" chart on Simpson Manufacturing from Stockcharts.com, we can see a
beautiful chart with the stock selling as low as $10.50 in December, 2000, and climbing steadily to the $38.01 level today. The stock has traded consistently above the support line and the graph looks strong to me!
So what do I think about this stock? Well, I wish I had purchased some shares in 2003 when I first discussed the stock. Otherwise, the latest quarter was solid, the Morningstar.com looks great with steady revenue and earnings growth, and except for one dip in free cash flow, that has been strong as well. The balance sheet is superb, the valuation is maybe a tad rich, but the P/E isn't bad. In addition, the company might just be under a bit of a squeeze as short-sellers hustle to cover. To top it off, the chart looks beautiful with a steady appreciation in stock price over the past 5 years!
Anyhow, I don't have any cash to buy stock, and don't have a "permission slip" to add a position. I am waiting for the time when I can sell a portion of my existing holdings at a gain, "entitling" me to add a new position as long as I am below 25 stock holdings.
Thanks for stopping by! Please feel free to leave any comments or questions on the blog or email me at bobsadviceforstocks@lycos.com.
Bob
"Revisiting a Stock Pick" K-Swiss (KSWS)
Hello Friends! Thanks so much for stopping by and visiting my blog,
Stock Picks Bob's Advice. As always, please remember that I am an amateur investor, so please remember to consult with your professional investment advisors prior to making any investment decisions based on information on this website.

Looking through the
list of top % gainers on the NASDAQ today, I came across K-Swiss (KSWS) which, as I write, is trading at $32.71, up $2.59 or 8.60% on the day. I do not own any shares nor do I have any options on this company.

I first
posted K-Swiss (KSWS) on Stock Picks Bob's Advice on July 3, 2004, when it was suggested to me by a reader named Leon. Hey Leon, if you're out there, that was truly a great stock pick!
At that time, KSWS was trading at $20.68, so since then, KSWS has appreciated $12.03, or 58.2% to the current price today!
According to the
Yahoo "Profile" on K-Swiss, the company "...engages in the design, development, and marketing of athletic footwear for sport, fitness activities, and casual wear in the United States and internationally."
On July 28, 2005, KSWS reported
2nd quarter 2005 results. For the quarter ended June 30, 2005, total worldwide revenues increased 17.2% to $126.5 million, compared to $107.9 million in the prior year same quarter. Net earnings climbed to $16.8 million from $13.2 million the prior year, and diluted earnings per share were up 34.3% to $.47/share from $.35/share the prior year same period.

Looking longer-term at a
"5-Yr Restated" financials from Morningstar.com, we can see a nice picture of steadily increasing revenues from $223.1 million in 2000 to $503.8 million in the trailing twelve months (TTM).
Earnings have
also steadily increased without interruption from $.49/share in 2000 to $2.22/share in the TTM. The company has increased dividends as well from $.02/share in 2000 to $.13 reported in the TTM. The number of shares outstanding has also been
declining(!) from 41 million in 2000 to 34 million in the TTM.
Free cash flow has been solidly positive, with $25 million in 2002, increasing to $80 million in the TTM.
The balance sheet is also gorgeous with $134.6 million in cash alone, enough to pay the combined $50.7 million in current liabilities
and the $15.1 million in long-term liabilities more than two times over. In addition, the company, according to Morningstar, has an additional $152.7 million in other current assets.

Looking at
Yahoo "Key Statistics" on KSWS, we find that the company is a mid cap stock with a market capitalization of $1.11 billion. The trailing p/e is a reasonable 14.70, with a forward p/e (fye 31-Dec-06) of 15.0. The PEG is reasonably priced at 1.11.
Evaluating the Price/Sales ratio, using the
Paul Sturm approach from Smart Money, I like to compare this value to other companies in the same industrial group. In the case of K-Swiss, using the
Fidelity.com eresearch website, we find that KSWS is in the "Textile-Apparel Footwear/Accessories" industrial group. Within this group, KSWS is moderately priced in terms of Price/Sales. Topping this group is Coach (COH), another favorite of mine, at 7.4, next is K-Swiss (KSWS) at a Price/Sales of 2.1, Nike (NKE) at 1.6, Timberland (TBL) at 1.4, Wolverine World Wide (WWW) at 1.2 and Reebok (RBK) at 0.9.
Going back to Yahoo for some more numbers, we can see that there are only 34.05 million shares outstanding. As of 9/12/05, there were 1.69 million shares out short representing 5% of the float or 6.9 trading days of volume (the Short Ratio). Using my own proprietary "3 day rule" on short interest, this looks significant and could be driving the stock higher!
Yahoo reports that the company does pay a small dividend with a trailing rate of $.15/share yielding 0.70%. The last stock split was 12/29/03, when the stock split 2:1.
What about a chart? Looking at a
Stockcharts.com "Point & Figure" chart on KSWS:
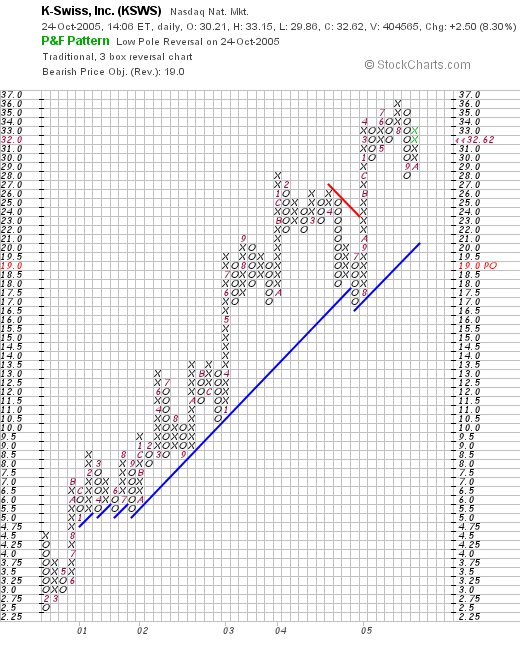
We can see an absolutely beautiful chart with the stock showing persistent strength since February, 2000, when it was trading down around $2.50, climbing to its current level around $32.62 without breaking-down below the support line! I like the chart.
So what do I think? Well, first of all I don't own the stock. Next, I thank Leon, who wrote in bringing this up last year in the first place. The latest quarterly report was solid. The Morningstar.com analysis looks great with solid five year revenue and earnings growth, nice free cash flow, a great balance sheet, and valuation that looks reasonable. Finally the chart looks terrific. I mean the company even pays a dividend! What is there not to like?
Now, if I just had the "entitlement" to be purchasing a stock today (that is, if I had sold some shares of an existing position at a gain), I might just be nibbling on this one!
Thanks so much for stopping by! If you have any questions or comments, please feel free to leave them right on the blog or email me at bobsadviceforstocks@lycos.com.
Bob
Posted by bobsadviceforstocks at 1:27 PM CDT
|
Post Comment |
Permalink
Updated: Monday, 24 October 2005 3:27 PM CDT
Saturday, 22 October 2005
"Looking Back One Year" A review of stock picks from the week of August 9, 2004, and August 16, 2004

Hello Friends! Thanks so much for stopping by and visiting my blog,
Stock Picks Bob's Advice. As always, please remember that I am an amateur investor, so please remember to consult with your professional investment advisors prior to making any investment decisions based on information on this website.
Excuse me for not getting a post last weekend but as this picture from the Loyola University Chicago website shows, Chicago is the keeper of the famous Water Tower and Michigan Avenue shopping district. I was there at a meeting, and didn't have a chance to get to a P.C. (Maybe it is time to purchase a laptop?)
One thing I like to do on weekends around here is to look back about a year, moving ahead week by week, and see how my "picks" have turned out. Sometimes I look absolutely brilliant and other times, well...you know. One thing to point out in all of this analysis is that the review assumes a buy and hold strategy and in fact I have implemented a strategy diametrically opposed to that philosophy. When my stocks drop 8% I sell them quickly after an initial purchase; otherwise, I sell them slowly as they appreciate.
By the way, I am reviewing two weeks of picks this evening because, in fact, I didn't pick any stocks at all during the August 9, 2004 week! Thus, even though I missed a week of reviews last weekend, I can easily get back on pace reviewing two weeks work of picks! Thus, the August 16, 2004, week shall be reviewed next :).
 On August 16, 2004, I picked Lowe's (LOW) for Stock Picks Bob's Advice at a price of $49.11. LOW closed at $61.22 on 10/21/05 for a gain of $12.11 or 24.7%.
 On August 15, 2005, Lowe's reported 2nd quarter 2005 results. Sales for the quarter ended July 29, 2005, increased 17.3% to $11.9 billion up from $10.2 billion in the same quarter last year. At least as important, same store sales for the quarter climbed 6.5%. Net earnings came in at $838 million, up 19.7% over the prior year same quarter. Diluted EPS grew 20.7% to $1.05/share up from $.87 last year. This was a strong quarter for LOW.
 On August 19, 2004, I posted PETCO (PETC) on Stock Picks Bob's Advice when it was trading at $32.90. Unfortunately, the stock has not done well the past year and closed on 10/21/05 at $18.51, down $(14.39) or (43.7)%.
 On August 25, 2005, PETCO (PETC) reported 2nd quarter 2005 results. Net sales for the second quarter ended July 30, 2005, came in at $482.7 million, up 10% from the prior year when the company had sales of $438.5 million. Comparable store sales increased 2.5%. Net income for the quarter came in at $18.0 million or $.31/diluted share down from $19.3 million or $.33/diluted share in the same quarter last year.
 Finally, on August 21, 2004, I posted Pixelworks (PXLW) on Stock Picks Bob's Advice when it was trading at $10.96. PXLW closed at $5.44 on 10/21/05 for a loss of $(5.52) or (50.4)%.
On July 27, 2005, PXLW reported 2nd quarter 2005 results. Revenue came in at $41.3 million down from $48.5 million in the same period las year. The company reported a net loss of $(2.3) million or $(.05)/share, down from a profit of $8.9 million or $.12/share.
So how did I do with my stock picks that week in August, 2004? In a word, AWFUL! Of the three stocks, one had a nice gain and two had awful results. The average of these three theoretical investments, utilizing a 'buy and hold' strategy was a loss of (23.4)%. This only goes to show you how I am truly an amateur; while I sometimes seem to work near-miracles in investing, I may also occasionally lose money!
Thanks so much for stopping by! If you have any comments or questions, please feel free to leave them right here on the blog or email me at bobsadviceforstocks@lycos.com.
Bob
Posted by bobsadviceforstocks at 10:06 PM CDT
|
Post Comment |
Permalink
Updated: Saturday, 22 October 2005 10:14 PM CDT
"Weekend Trading Portfolio Analysis" Cytyc (CYTC)

Hello Friends! Thanks so much for stopping by and visiting my blog,
Stock Picks Bob's Advice. As always, please remember that I am an amateur investor, so please remember to consult with your professional investment advisors prior to making any investment decisions based on information on this website.

I must first apologize for missing this post last weekend. I was away from my computer and I am sure I suffered more from separation anxiety than any of my readers :).
With the ongoing correction in the market, I have hit sale points on the downside for additional holdings in my trading account and am now down to 21 positions with my maximum number being 25. As you probably know, when I sell a stock on "bad news", which I consider anything other than selling on a gain, I do not reinvest those funds. Thus, to add a new position, I shall be awaiting for a sale on "good news" which will 'entitle' me to investigate, and purchase another name for the portfolio.

What I have started doing around here, besides just talking about stock market possibilities, is to take the time and share with you each of my holdings, the history of my purchases and sales, and my current 'take' on that stock.
Two weeks ago, I
discussed Cooper (COO) on Stock Picks Bob's Advice. Going alphabetically, I am now up to my Cytyc position (CYTC). According to the
Yahoo "Profile" on Cytyc, this company "...engages in the design, development, manufacture, and marketing of clinical products primarily focused on women's health. Its products cover a range of women's health applications, including cervical cancer screening, breast cancer risk assessment, and treatment of excessive menstrual bleeding."
In my trading account, I purchased 500 shares of Cytyc (CYTC) at a cost basis of $14.86 on 1/29/04. I made my first sale of CYTC on 3/1/04, selling 100 shares, at a price of $18.63 for a gain of $3.77 or 25.4% (a little earlier than my usual first target today of 30%). My second sale of CYTC was a 100 share sale on 4/2/04 at a price of $22.61, for a gain of $7.75/share or 52.2% (again a bit early as I currently wait for a 60% appreciation level to make my second partial sale). My third sale was 75 shares of my remaining 300 shares on 6/2/04 at a price of $22.79, representing a gain of $7.93 or 53.4%. (I actually remember realizing I had sold this stock earlier than I should have :(...shows what happens when you do things manually I guess...normally, my third sale would be at a 90% gain point!). Currently, I have 225 shares remaining of CYTC which closed 10/21/05 at $25.86, representing an unrealized gain of $11.00 or 74%. Since I have made three sales already, my next targeted sale will be at a 120% gain level or to calculate, $14.86 x 2.20 = $32.69. On the downside, even though I made mistakes on my third sale especially, I shall still act as if it were at 90% and thus, on the downside, I anticipate selling the remaining shares at $14.86 x 1.45 = $21.55. (at a 45% gain level).

Well, let's take a quick look at the stock.
On July 27, 2005, Cytyc
reported 2nd quarter 2005 results. Revenues for the quarter climbed 26% to $125.4 million, up from $99.5 million for the same quarter the prior year. Net income grew 28% to $28 million, up from $21.9 million the prior year. On a diluted eps basis, earnings grew 21% from $.23 vs. $.19/share the prior year. These were solid results!
Taking a look at the
Morningstar.com "5-Yr Restated" financials, we can see a beautiful picture of growing revenue from 2000 at $142.1 million, increasing to $452.2 million in the trailing twelve months (TTM).
Earnings have been a tad erratic, increasing from $.32/share in 2000 to $.83/share in the TTM, with small declines in 2001, and 2004.
Free cash flow remains solidly positive with $91 million in 2002 growing to $118 million in the TTM. The balance sheet shows plenty of current assets with $97 million in cash and $100.7 million in other current assets vs. $54.4 million in current liabilities. The excess in current assets is enough to cover about half of the long-term liabilities of $315.4 million.
What about a chart? Taking a look at the
"Point & Figure" chart on CYTC from Stockcharts.com:
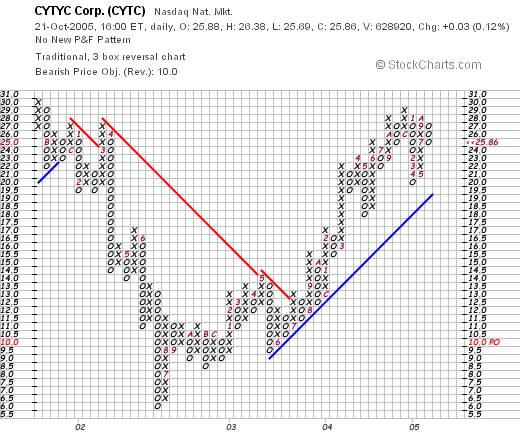
We can see that the stock actually was declining between 2001 when it was trading at $30, and then declining to a bottom of $6 in June, 2002. Since then the stock has been climbing, breaking through resistance in July, 2003, and climbing to its current level at around $25.86 today. The graph looks solid imho, and does not appear to have gotten ahead of itself.
So what do I think? Well, I do own the stock :), and I have done well with it so far. The stock is a very small company, and appears to have plenty of room to grow!
Thanks so much for stopping by! If you have any comments or questions, please feel free to leave them on the blog or email me at bobsadviceforstocks@lycos.com.
Bob
Friday, 21 October 2005
A Reader Writes: "I think I learned the meaning of gapping down."
Hello Friends! Thanks so much for stopping by and visiting my blog,
Stock Picks Bob's Advice. As always, please remember that I am an amateur investor, so please remember to consult with your professional investment advisors prior to making any investment decisions based on information on this website.

My good friend, Bob K., has written in again about his own experience with a stock that makes up much of his retirement assets due to previous employment. Bob wrote:
Hi Bob,
This might not be for your blog as I feel very stupid. I think I learned the meaning of gapping down. I awoke Tuesday morning to find my American Standard lost over $50,000 over night on a 2 cent earnings miss and a down guidance on plumbing which is only 17% of their business. I'm holding on because I don't know what else I'd invest it in anyway and I believe the dead cat will bounce. I think ASD might be a pretty good bargain now. So much for lack of diversity. I knew the company wasn't really in trouble and never imagined such severe punishment. Oh well, thanks for listening.
Bob
First of all, from one Bob to another, you are not stupid. You are the victim of your own retirement plan which loaded you up with the stock of your former employer, American Standard. This points out the need for diversification in one's assets. Personally, in my own trading account, I aim for 25 different positions so that if one implodes and gaps down, the effect isn't as devastating as might be otherwise. I have had my share of implosions, and thus, another reason to try to take profits as a stock appreciates, effectively removing ones cost from an investment.

Otherwise, you may find that your profits, your assets, and your retirement funds have literally gone down the American Standard crapper so to speak. Please excuse my potty humor. Couldn't really help myself!
Let's take a closer look at American Standard (ASD). ASD closed today at $37.74, up $.62 or 1.67% on the day. This was a bit of a rebound from your previously noted decline.
As you reported, on October 18, 2005, the company
reported 3rd quarter 2005 results. Sales climbed 9.5% to $2.62 billion, with earnings per diluted share up 4% to $.74/share. This is at best a bit anemic in terms of growth. But of more concern was the smaller headline on the same report:
- Company reduces full-year earnings estimate from $2.60-$2.75 to $2.54- $2.58, an increase over 2004 of 79-82 percent on a GAAP basis, 13-15 percent on an adjusted basis
. This was a double "hex" on the stock....first they
missed estimates, and second, the company reduced guidance. All of those imaginary computers that I picture analysts using immediately recalculated the appropriate "current value" of the stock, and the stock pulled back rather decisively.
What does the Morningstar.com report look like? Checking the
Morningstar.com "5-Yr Restated" financials, we can see a steady picture of revenue growth from $7.6 billion in 2000 to $9.8 billion in the trailing twelve months.
Earnings have been a little less consistent (a problem we are once again revisiting), with a decrease from $1.45 to $1.35 between 2000 and 2001, then back to $1.83 by 2003, and declining again to $1.42 in 2004 but increasing once again to $1.84 in the TTM. Consistency is a very important factor in assessing valuation. Investors regularly pay a premium for increased certainty of results. And thus, a discount to inconsistent reports.
Free cash flow has been solidly positive with $518 million reported in the TTM. And the balance sheet looks fine with $3.2 billion in current assets combined, compared with $2.4 billion in current liabilities and a larger $3.6 billion in long-term liabilities on the Morningstar page.
What about the chart? Looking at the
ASD "Point & Figure" chart from Stockcharts.com:
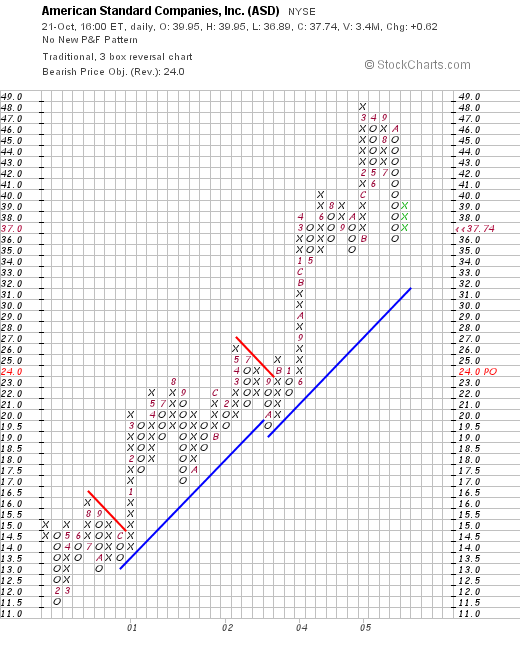
We can see what looks to me like a superb chart with steady appreciation from February, 2000 when the stock was down around $11.50 to the current level of $37.74. The stock does not appear to have broken down, but I would be more concerned if it breached the "support level" of around $33. But then I am, as you know, just an amateur technician!
So what should you do? First of all, in general it is wise to diversify your assets. I do not sell on 8% declines. I sell a stock if it declines to a level that either I have an 8% loss, or it reaches another sell-point. I suspect, since you probably have held ASD for many years, that your cost is much much lower than the current price. Thus, I wouldn't panic. However, regardless of your cost, I would work at moving some of this concentrated holdings out into other positions on your own assessment of timeliness. ASD might be the greatest stock ever in the next twelve months or twelve years, but you are far too nice a friend to concentrate all of your eggs in that one basket!

Thanks so much again for writing. I hope that you don't mind that I took the opportunity of answering you with your question by writing an entry in the blog! I guess that's the risk one takes writing to me these days :).
Regards! If you have any other questions or comments, please feel free to leave them right in the blog or email me at bobsadviceforstocks@lycos.com.
Bob
"Revisiting a Stock Pick" SanDisk (SNDK)
Hello Friends! Thanks so much for stopping by and visiting my blog,
Stock Picks Bob's Advice. As always, please remember that I am an amateur investor, so please remember to consult with your professional investment advisors prior to making any investment decisions based on information on this website.

As you know if you are a regular reader on this blog, I like to identify stocks that show potential to appreciate in price based on momentum and fundamental evaluation. After listing a stock, I try very hard to avoid "revisiting" the same name for at least a year! It is time to take another look at SanDisk (SNDK).
According to the
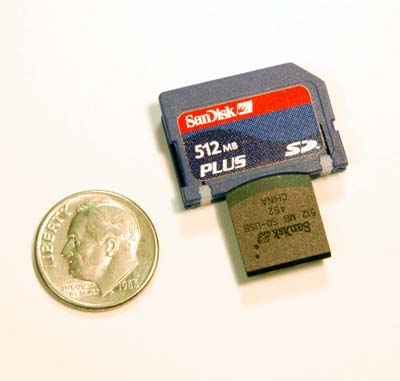
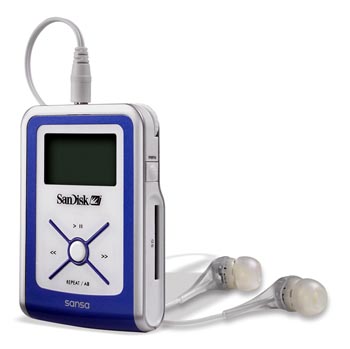
Yahoo "Profile" on SanDisk, the company "...engages in the design, development, and market of flash storage card products used in various consumer electronics worldwide. Its products include flash cards, Universal Serial Bus, flash drives, and digital audio players."
I first
posted SanDisk (SNDK) on Stock Picks Bob's Advice on July 15, 2004, when the stock was trading at $24.96. Unfortunately, I didn't buy any shares, nor do I own any shares or options at this time. Today, SanDisk made the
list of top % gainers on the NASDAQ, closing at $56.45, up $10.07 or 21.71% on the gain. Today's close is an appreciation of $31.49 or 126% since posting a little over a year ago on this blog!
What drove the stock higher today, was the announcement of
3rd quarter 2005 earnings results. For the quarter ended October 2, 2005, revenues climbed 45% to a record $590 million. Net income was up approximately 100% at $107.5 million, up from $54.1 million in the same quarter last year. Fully diluted EPS came in at $.55, up 90% over the prior year's results. These were great results, and the market reacted as expected pushing the stock price higher.
How about longer-term? Reviewing the
Morningstar.com "5-Yr Restated" financials, we can see that revenue declined from $600 million in 2000 to $400 million in 2001. Since that time, revenue growth has been robust, growing to $1.9 billion in the trailing twelve months (TTM).
Earnings also dipped that same year from $2.06 in 2000 to $(2.19)/share in 2001. However, the next year the company was profitable earning $.25/share in 2002 and has increased earnings dramatically to $1.48/share in the TTM.
Free cash flow has been positive and generally growing from $90 million reported in 2002 to $184 million in the TTM.
Looking at the balance sheet on Morningstar, we find that the company is loaded with cash, with $1.45 billion in cash and $663 million in other current assets. This dwarfs the $461.4 million in current liabilities and the $22.2 million in long-term liabilities reported. This is a very strong balance sheet!
Looking at
Yahoo "Key Statistics" on SNDK, we can see that the company is a large cap stock with a market capitalization of $10.26 billion. The trailing p/e is a bit rich at 38.12, but the forward p/e (fye 02-Jan-07) is much better at 29.10.
Reviewing
Fidelity.com eResearch website, we can see that SanDisk is the most expensive stock in the "Semiconductor-Memory Chips" industrial group. SNDK tops out the list with a price/sales of 4.6, followed by Silicon Image (SIMG) at 3.5, M-Systems Flash Disk Pioneers (FLSH) at 3, Micron Technology (MU) at 1.7, and Lexar (LEXR) at 0.7.
Looking back at Yahoo for additional statistics, we find that there are 181.75 million shares outstanding and currently 11.75 million shares out short. This represents 6.605 of the float or a short interest ratio of only 2.2. This doesn't look like a lot of shares out short (imho) using my own cut-off of 3 days of short interest.
SanDisk does not pay a cash dividend according to Yahoo and the last stock split was a 2:1 split on February 19, 2004.
What about a chart? Looking at the
Stockcharts.com "Point & Figure" chart on SNDK:
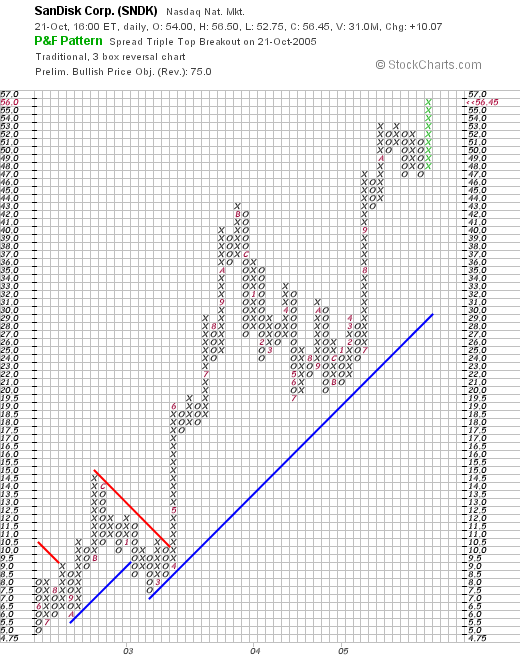
We can see that ever since the stock broke through resistance at about $9.00 in April, 2003, the stock has traded higher, even though it has been a bit erratic. In my humble opinion, the stock chart looks strong.
So what do I think? Well, on the positives, the latest quarter was absolutely superb. The last five years have shown strong growth in revenue and earnings, the free cash flow is positive and the balance sheet is exceptionally strong. In addition the chart looks great!
What do I not like? Well, all things considered, I like a bargain rather than a fully priced stock. This stock sports a p/e in the high 30's, a PEG at 1.52 (with 1.0 being 'fairly' valued) and a Price/Sales at the top of the group. In spite of all that, the latest quarterly report is so spectacular, that I would dare say the company is still a reasonable value!
Thanks again for stopping by! Have a great weekend! If you have any questions or comments, please feel free to post them right here on the blog, or email me at bobsadviceforstocks@lycos.com and I will try to get back to you, either by email or right on the blog itself!
Bob
Newer | Latest | Older


