Stock Picks Bob's Advice
Monday, 21 November 2005
"Revisiting a Stock Pick" Bentley Pharmaceutical (BNT)
Hello Friends! Thanks so much for stopping by and visiting my blog
Stock Picks Bob's Advice. As always, please remember that I am an amateur investor, so please remember to consult with your professional investment advisors prior to making any investment decisions based on information on this website.

Reviewing the
list of top % gainers on the NYSE, the place where I like to begin my search for picks for this blog, I came across Bentley Pharmaceuticals (BNT) which closed at $17.92, up $2.02 or 12.70% on the day. I do not own any shares nor do I have any options on this stock.

Bentley is an old pick of mine, having
posted Bentley (BNT) on Stock Picks Bob's Advice on October 3, 2003, a bit over two years ago when Bentley was trading at $15.69/share. Since that original post, Bentley has only appreciated $2.23 (only a little more than today's move) or 14.2% since posting.
According to the
Yahoo "Profile" on Bentley:
Bentley Pharmaceuticals, Inc. operates as a specialty pharmaceutical company. It focuses on developing, licensing, and sale of generic and branded pharmaceutical products and active pharmaceutical ingredients, and the manufacturing of pharmaceuticals for others; and research, development, and licensing/commercialization of advanced drug delivery technologies and pharmaceutical products. Bentley pharmaceuticals manufactures and markets approximately 120 pharmaceutical products for various dosage strengths and product formulations of approximately 30 chemical entities in four primary therapeutic areas: cardiovascular, gastrointestinal, neurological, and infectious diseases; as well as markets over-the-counter products.
On November 2, 2005, BNT (which is now on the NYSE)
announced 3rd quarter 2005 results. Revenue for the quarter ended September 30, 2005, came in at $23.5 million, a 30% increase over the $18.1 million reported in the prior year. Net income grew 76% to $2.5 million or $.11/diluted share.
How about longer-term? Taking a look at my next favorite place to find information, Morningstar.com, in particular reviewing the
"5-Yr Restated" financials on Bentley, we can see a beautiful picture of increasing revenue from $19 million in 2000 to $86.6 million in the trailing twelve months (TTM).
Earnings during this same period have improved from a loss of $(.06)/share in 2000 to earnings of $.36/share in the TTM.
Free cash flow, while erratic, has improved from $(2) million in 2002 to $2 million in the TTM. The balance sheet, as reported on Morningstar.com, appears solid with $37 million in cash, enough to cover both the $31.5 million in current liabilities
and the $4.9 million in long-term liabilities. The company is also reported to have an additional $41.4 million in other current assets.
How about valuation? Looking at
Yahoo "Key Statistics" on Bentley, we can see that this is a small cap stock (under $500 million in market capitalization) with a market cap of only $391.39 million. The trailing p/e is a bit rich at 43.81, but the forward p/e is better at 32 (fye 31-Dec-06). However, growth going forward is so great that the PEG comes in at 0.94.
Using the
Fidelity.com eResearch website, we can see that Bentley has been assigned the "Drug Delivery" industrial group. Within this group, the Price/Sales ratio is rather reasonable. Topping the group is Alkermes (ALKS) with a Price/Sales ratio of 15.1, then Nektar Therapeutics (NKTR) at 11.2, ELAN (ELN) at 9.6, then Bentley (BNT) at 4.1, Biovail (BVF) at 4.0 and Andrx (ADRX) at 1.2.
Going back to Yahoo for some additional numbers, we can see that there are only 21.84 million shares outstanding. Currently, there are 1.46 million shares out short with a short ratio (10/11/05)
get this of 34.4! In other words, it would take SEVEN WEEKS of five days/week trading volume just for the shorts to cover this relatively illiquid stock. If I use my modest 3 day short ratio rule, this is one of the biggest short ratios I have ever found on this blog....and it looks pretty significant to me. I wouldn't want to be short shares right now with the stock climbing and very few shares available to buy back. Just my opinion though :).
No cash dividend is reported, and the last stock split was actually a
reverse 1:10 split in July 25, 1995.
What about the chart? If we look at a
"Point & Figure" chart for Bentley:
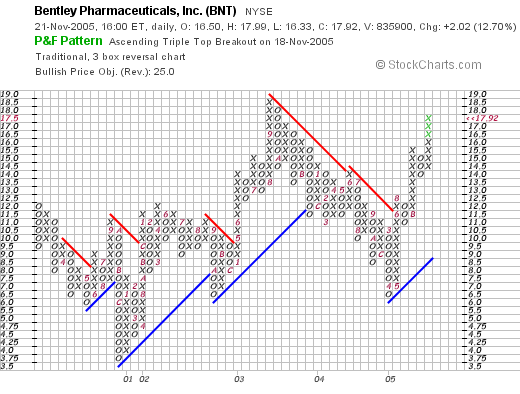
We can see what looks like a fairly nice move higher from a low of $3.75 in Decmber, 2000, to a high around $18.50 in September, 2003. However, the stock broke down at that point trading all the way down to $7.00 in April, 2005, until moving higher recently, breaking through resistance in June, 2005 at $12.50, and trading higher to the current level. The stock looks short-term to be moving ahead, but long-term, has been a rather unimpressive stock price move.
So what do I think? Well, if I had sold my HIBB earlier, I might be buying some of these shares today. However, I shall be waiting to see what is moving tomorrow to pick a stock, if I do. Otherwise, the recent quarterly report was solid; by the way, this company does most of its sales in Spain, the Morningstar.com report looks great, and valuation is reasonable with a PEG under 1.0 and a Price/Sales in the middle of the group. The chart, however, looks just fair.
A real wild-card, imho, is the HUGE short-interest. This data is a bit stale, and I don't really know how many shares are out short as I write, but think about how many shares were out short...and the time it would take to cover. Might be a bit of a squeeze going on.
Anyhow, thanks for visiting here. If you have any questions or comments, please feel free to email me at bobsadviceforstocks@lycos.com or leave your words right here on the blog!
Bob
"Trading Transparency" Hibbett (HIBB)
Hello Friends! Thanks so much for stopping by and visiting my blog,
Stock Picks Bob's Advice. As always, please remember that I am an amateur investor, so please remember to consult with your professional investment advisors prior to making any investment decisions based on information on this website.
A few moments ago, just before the close of trading, I noticed that my Hibbett Sporting Goods (HIBB) had hit a sales target, with a 360% gain over my initial purchase. This is my 8th sale of Hibbett stock, each time selling approximately 1/4 of my remaining shares. As you will recall, if you have been reading my posts here, I sell 1/4 of my shares at the following appreciation levels: 30%, 60%, 90%, 120%, and then by 60% intervals--180%, 240%, 300%, and 360%, and after that by 90% intervals: 450%, etc.
My initial purchase of Hibbett (HIBB) was on March 6, 2003, when I picked up my shares with a cost basis of $6.50. Owning 111 shares of HIBB prior to this sale, I entered an order to sell 27 shares (leaving 84 shares in the account) at $30.11. This was a gain of $23.61/share or 363.2% over my purchase price (!). Thus, my next sale point on the upside would be selling 21 shares at a 450% gain or 5.5 x $6.50 = $35.75, or on the downside at a 180% gain level, I would be selling all of my remaining 84 shares: 2.8 x $6.50 = $18.20.
The
exciting thing about this sale is that I can use this as a signal to add a new position into my portfolio. (Since I am at only 19 positions, with my maximum being 25.) Thus I shall be on the look-out tomorrow, scouring the top % gainers list, looking for something special! I shall keep you posted.
Regards again to all of you readers. Please let me know if you have any comments, questions or other thoughts on what I write, and investing in general. Please feel free to post your words right on the blog or email me at bobsadviceforstocks@lycos.com and I shall try to get to your letter. I cannot get to all of the emails I receive, but I try to answer as many as I can (usually right in the blog).
Bob
Sunday, 20 November 2005
"Trading Portfolio Update" via "Jubak's Refugee Site" on MSN
Hello Friends! Thanks so much for stopping by and visiting my blog,
Stock Picks Bob's Advice. As always, please remember that I am an amateur investor so please remember to consult with your professional investment advisors prior to making any investment decisions based on information on this website.
One of the things I firmly believe in around here is transparency. I want you to know what I own, why I own it, when I sell it, etc. I don't want to talk about any stocks with you thinking that maybe I own these shares or not. In addition, the value of this blog is to share with you the process of investing, and see how it all works out. Hopefully, I shall inspire others to invest, to think about stocks, and maybe even to share their experiences for all of us to learn from.
One other site that I have been participating in on the internet is the MSN financial website where there are lots of bulletin boards where people share ideas. I have been encouraging people over there to visit my blog (I love to get visitors), and to enter into the discussion here. As part of that process, I have been sharing my portfolio status with the readers. Tonight, I wrote this up on the
Jubak Refugee Website on MSN. Since some of you might wonder about how I am doing, and since I have not been updating my trading portfolio page, here is what I wrote tonight:
Hello Jubak Refugee Friends!
One of the things I have been posting here is an update on my trading portfolio, based on my strategy in my blog, Stock Picks Bob's Advice. I posted last on October 1, 2005, and now, November 20, 2005, being 7 weeks later, I wanted to give you an update.
I am presently down to 19 positions (with my maximum being 25 positions in my trading portfolio).
On 10/12/05, I withdrew $5,000 cash from my account, adding to my margin to make a downpayment on a new (used) vehicle :). In addition, I have started making $550 payments/month to pay off the car out of this account, and only add $200/month as a contribution from my checking. So this is a bit of a drag on the account. My last monthly margin payment on the account on 10/20/05 was $470.59, so this is another drag on the account performance. I want to share this "laundry" with you so that you can see that my performance, even with all of this, isn't that bad at all!
As of 11/19/05, the account net worth was $78,393.35. I have, in spite of all the things mentioned in the above paragraph, been paying down margin, which is now down to $40,127.16. On 10/1/05, the margin was $70,266.83, so this has really shrunk with the sale of some positions. The equity position is now up to 66.14%. Total holdings are also down at $118,520.51.
As of 11/20/05, unrealized gains stand at $42,870.23. Realized gains stand at $6,174.91 short-term, and $15,347.02 long-term, net, for total net gains for 2005 as of this date of $21,521.93. I have now paid a total of $4,180.36 in margin interest payments this year as well.
Current positions (# shares) in my trading portfolio: AFFX (120), AMHC (128), CDIS (113), COH (102), COO (45), CYTC (225), GCO (200), HIBB (111), JOSB (180), KYPH (150), PRGS (240), QSII (58), RMD (180), SBUX (70), SRX (320), STJ (180), SYD (113), VIVO (253), VMSI (225).
Since 10/1/05, the following transactions have occurred: On 10/3/05, I sold 84 shares of VIVO, and on the same day received 90 shares of RMD as part of a stock distribution. Also on 10/3/05, I sold 19 shares of QSII. On 10/6/05, I sold 120 shares of DELL, and on 10/13/05, I sold 400 shares of ZQK. On 10/20/05, I sold 113 shares of MNT, and on 10/20/05 I sold 160 shares of GI. On 10/24/05, I received 35 shares of SBUX in a stock distribution, and on 10/25/05, I sold 200 shares of ADS. I sold my 230 shares of AMMD on 10/28/05.
You can see that with the market correction, I have reduced my margin balance, and thus my leverage and exposure to the market. The stocks are recovering and a couple of my stocks (QSII and KYPH) in particular are near sale points on gains and thus may be entitling me to add a new position or two. Time will tell.
Please come by and visit my blog and let me know what you think! In the interim, I shall continue to try to provide updates monthly or so on what has been going on in my trading portfolio and the financial results. I believe if you go back a year ago, right here on this site, on 10/16/04, I was reporting a trading account net worth of $47,933.49. Thus, the market has been kind to me the past twelve months!
Bob
I hope that this information is helpful to you too. Unfortunately, I have real expenses and financial needs, and have been drawing down money from my trading account for various purposes (like buying a car :) ). But this gives you an update on all of my holdings, my current value and net gains and losses. The results are pretty satisfying from my perspective :).
Thanks so much for visiting again. I hope you all have a nice week trading and come and visit here often. If you have any particular questions, or comments, please feel free to leave them on the blog or email me at bobsadviceforstocks@lycos.com.
Bob
Posted by bobsadviceforstocks at 10:26 PM CST
|
Post Comment |
Permalink
Updated: Sunday, 20 November 2005 10:39 PM CST
Saturday, 19 November 2005
"Looking Back One Year" A review of stock picks from the week of September 13, 2004

Hello Friends! Thanks so much for stopping by and visiting my blog,
Stock Picks Bob's Advice. As always, please remember that I am an amateur investor, so please remember to consult with your professional investment advisors prior to making any investment decisions based on information on this website.
As I mentioned in my previous post, there are two things that I am trying to accomplish with this blog: first to look at stocks that appear attractive to invest, and follow-up at a later date to see how these ideas turned out; and to follow an actual trading portfolio with my strategy. The weekend reviews like this are designed to examine past stock selection ideas on this blog and see how they turned out. This evaluation is limited by a decision to review these picks with a "buy and hold" strategy. In fact, I actually sell my losing stocks quickly at an 8% loss level, and sell my gaining stocks slowly at pre-determined appreciation targets.
During the week of September 13, 2004, I "picked" two stocks for this blog: eResearch (ERES), and Syneron Medical (ELOS).

On September 14, 2004, I
selected eResearch for Stock Picks Bob's Advice when the stock was trading at $17.36. ERES closed at $13.89 on 11/18/05 for a loss of $(3.47) or (20.0)%.

On October 26, 2005, ERES
reported 3rd quarter 2005 results. For the quarter ended September 30, 2005, the company reported revenues of $20.9 million down from $28.0 million from the same quarter the prior year. In addition, Net income came in at $7.4 million, up from $4.0 million the prior year or $.13/diluted share, up from $.08/diluted share. Thus, although earnings were up for the quarter, revenue declined making this an unacceptable result imho.

On September 17, 2004, I
posted Syneron (ELOS) on Stock Picks Bob's Advice when the stock was trading at $15.20. ELOS closed at $40.82 on 11/18/05 for a gain of $25.62 or 168.6% since posting!

On November 3, 2005, ELOS
reported 3rd quarter 2005 results. For the quarter ended September 30, 2005, revenue climbed 68% to $25 million, from the $14.9 million reported in the third quarter of 2004. Net income for the quarter was up 100% to $14.6 million, up from $7.3 million. Earnings per diluted share almost doubled to $.53/share in the 3rd quarter, compared with $.29/diluted share the prior year same quarter. The company also raised revenue guidance for 2005 to $91-$92 million, up from the prior guidance of $84-$85 million.
So how did I do that week? Well, I had one loser down (20)% and one big winner with a big gain of 168.6%. Thus the average performance of the two was a gain of 74.3!
Thanks so much for stopping by!

Painting of a Thanksgiving scene by Antonio Esteves in 1978
Thanks so much for stopping by! Have a Happy Thanksgiving! And come back and visit again. Your comments and questions are welcome here, or if more convenient, you may email me at bobsadviceforstocks@lycos.com. Unfortunately, I cannot answer every email I receive, but I shall try to comment on as many as possible!
Bob
"Weekend Trading Portfolio Analysis" Kyphon (KYPH)

Hello Friends! Thanks so much for stopping by and visiting my blog,
Stock Picks Bob's Advice. As always, please remember that I am an amateur investor, so please remember to always consult with your professional investment advisors prior to making any investment decisions based on information on this website.
I was down at my local Barnes and Noble, sitting at the Starbucks coffee nook, and reading the latest
Business Week article on Peter Drucker last night. I can't remember the entire article but what struck me was his opinion that it was what one could contribute in one's life and not what one could achieve that mattered. I hope that this is what this blogging is about; that we all strive to contribute something to each other. I hope I am not being too Pollyanna this early in the morning :).

As I have pointed out in other entries, what I am doing in this blog is basically two-fold. I am presenting ideas and comments about stocks that look attractive to me as investments, and I am also implementing this philosophy with an actual trading portfolio of my own. As I make any actual trades, I intersperse these entries explaining my holdings and my trades between the other entries about stock market ideas. I suppose my amateur nature comes out in the lack of clear organization on the blog, but if you flip through the entries, I believe you will get a sense of the content.
This year, I started going through my actual holdings on weekends. This is a second weekend activity here; previously I initiated a review of past stock picks and I shall continue with that as well. I call those "Weekend Review", while the stock holdings review I call "Weekend Portfolio Review". Last week I
reviewed Jos A Bank (JOSB), an actual holding of mine in my trading portfolio. Going alphabetically through my current list of 19 holdings, I am up to Kyphon (KYPH).

My first purchas of Kyphon was on April 15, 2004, when I purchased 300 shares of KYPH at $28.16/share. I sold these shares 8 days later at $25.71, as I had incurred a loss of $(2.45) or (8.7)%.
I have been asked whether I sometimes revisit a stock and repurchase a stock I have sold. I did exactly this with Kyphon almost exactly a year later! On May 20, 2005, I purchased 200 shares of Kyphon at $29.18/share. The stock made a nice move that day, I had "permission" to purchase a new position in my portfolio, and the numbers were still compelling. By July 8, 2005, my shares had hit my first sale target, which if you have been reading my blog for awhile, you will know is at a 30% gain. At that point I sold 50 shares of KYPH, 1/4 of my holding, at $37.98, for a gain of $8.80 or 30.2%. I currently hold 150 shares of KYPH which closed at $45.73 on 11/18/05, for a loss of $(.67) or (1.44)% on the day. I currently have a "paper profit" of $16.55 or 56.7% on the shares. My next sales target is at either a 60% gain on the upside, in which case I plan on selling another 1/4 of my shares (approximately 37 shares) which would be at a price of 1.60 x $29.18 = $46.69, or I shall be selling
all of my remaining 150 shares if the stock should retrace to break-even or $29.18.

I have been following Kyphon on Stock Picks even before I ever made a purchase. I first
posted Kyphon on Stock Picks Bob's Advice on October 30, 2003, when the stock was trading at $29.15. KYPH hit the list of top percentage gainers again a year later and I
"revisited" Kyphon on Stock Picks Bob's Advice on May 20, 2005, the same day I went ahead and purchased some shares for my own trading account, when the stock was trading at $28.85. (I noted within that post that I added some shares to my trading portfolio.)
Let's take a closer look at this stock today. As I noted above, the stock closed on 11/18/05 at $45.73. According to the
Yahoo "Profile" on Kyphon:
Kyphon, Inc., a medical device company, engages in the design, manufacture, and marketing of medical devices to treat and restore spinal anatomy using minimally invasive technology. The company?s products include KyphX Bone Access Systems, which is used to create a working channel into fractured bone; KyphX Inflatable Bone Tamps, to compact soft inner bone and move hard outer bone; KyphX Xpander Inflation Syringe, to inflate the KyphX Inflatable Bone Tamps; and KyphX Bone Filler Device that deliver bone filler materials into bone cavity.
On November 1, 2005, Kyphon reported
3rd quarter 2005 results. The results were excellent:
SUNNYVALE, Calif., Nov. 1 /PRNewswire-FirstCall/ -- Kyphon Inc. (Nasdaq: KYPH - News) today announced that net sales for the quarter totaled $79.0 million, an increase of 42% over the $55.8 million in net sales reported for the third quarter of 2004. Earnings per diluted share for the quarter increased 86% to $0.26 compared to earnings per diluted share of $0.14 for the same period a year ago.
How about 'longer-term'? For this, I like to use the Morningstar.com website. In particular, looking at the
"5-Yr Restated" financials, we can see that revenue has grown steadily from $6.1 million in 2000 to $259.5 million in the trailing twelve months (TTM).
Earnings have been a bit erratic with $.65 reported in 2003, dropping to $.50 in 2004, but increasing to $.60/share in the TTM. With the latest strong earnings report, it appears that earnings growth has returned to a more consistent growth record.
Free cash flow has been improving nicely with $(2) million in 2002, improving to a positive $9 million in 2003, $21 million in 2004, and $33 million in the TTM.
As reported on Morningstar.com, the balance sheet is gorgeous with $142.8 million in cash, which by itself can cover both the $34 million in current liabilities
and the $3.9 million in long-term liabilities combined almost four times over. In addition, the company has another $78.6 million in "other" current assets. Looks pretty good to me!
What about "valuation"? Looking at
Yahoo "Key Statistics" on Kyphon, we can see that this is a mid-cap stock with a market capitalization of $1.99 billion. The trailing p/e is a rich 63.69, and the forward p/e is also rich at 37.79 (fye 31-Dec-06). The PEG comes in at 7.14, and the Price/Sales at 7.14.
Kyphon has only 43.49 million shares outstanding. As of 10/11/05, there were 3.78 million shares out short representing a significant (imho) 8.8% of the float or 6.4 trading days of volume. This looks like a possible factor in the stock moving higher as short sellers may be scrambling to cover. It certainly doesn't look like a negative factor to me.
The company does not pay a cash dividend and no stock splits are reported on Yahoo.
And what does the chart look like? Taking a look at the
"Point & Figure" chart from Stockcharts.com:
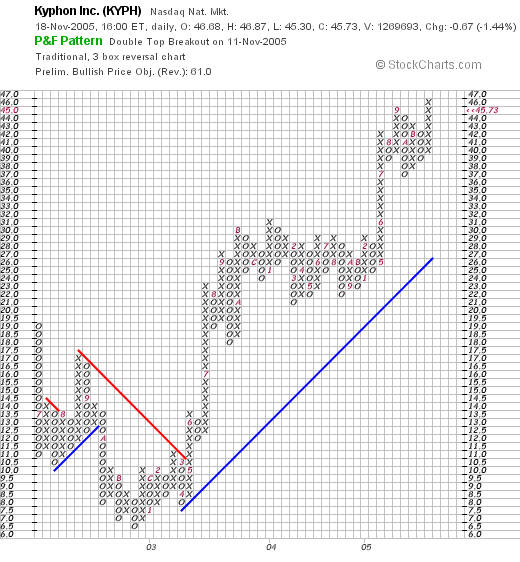
We can see that the stock was trading lower between June, 2002, when the stock was as high as $19, to a low of $6.50 in November, 2002. The stock broke through resistance at $10.50 in May, 2003, and hasn't looked back yet, staying above the support line and moving higher. The graph looks quite strong with the stock at the $47 level.
So what do I think? Well I am quite biased :), as I own the stock. But the latest quarter was quite strong, the Morningstar report looks great with growing free cash flow and a beautiful balance sheet. The chart is strong as well. On the downside, valuation looks rich with a P/E in the 60's and a Price/Sales over 7. However, the company is small and growing quickly. I shall be staying with the stock as long as the news is good and the stock price doesn't dictate any selling action to me.
Thanks so much for stopping by! I hope that my ramblings are helpful to you. If you have any questions or comments, please feel free to leave them on the blog or email me at bobsadviceforstocks@lycos.com.
Bob
Posted by bobsadviceforstocks at 8:53 AM CST
|
Post Comment |
Permalink
Updated: Saturday, 19 November 2005 12:25 PM CST
Friday, 18 November 2005
November 18, 2005 Brady Corp. (BRC)
Hello Friends! Thanks so much for stopping by and visiting my blog,
Stock Picks Bob's Advice. As always, please remember that I am an amateur investor, so please remember to consult with your professional investment advisors prior to making any investment decisions based on information on this website.
Last night, I was thinking of putting Brady (BRC) on the blog, but it was late and I put it off for another time. Today, Brady was once again on the
list of top % gainers on the NYSE today, and I have another chance to list the stock here on Stock Picks! Brady closed today at $38.90, up $1.60 or 4.29% on the day. I do not own any shares or options in this stock.
According to the
Yahoo "Profile" on Brady, the company "...engages in the manufacture and marketing of identification solutions and specialty materials worldwide."
What drove the stock higher Thursday, was the
announcement of 1st quarter 2006 results after the close of trading on Wednesday. For the quarter ended October 31, 2005, sales rose 16.1% to $232.6 million vs. $200.4 million in the same quarter last year. Net income climbed 48.3% to $30.2 million or $.60/diluted "Class A" share, compared with $20.4 million or $.41/share in the same quarter last year. In addition, the company
raised guidance for the rest of 2006. The combination of a strong earnings report combined with raised guidance was enough, as is often the case, to push the stock strongly higher!
Looking at the
Morningstar.com "5-Yr Restated" financials, we can see the relatively steady growth in revenue (except for a dip in revenue from $545.9 million in 2001 to $517.0 million in 2002) from $545.9 million in 2001 to $816.4 million in 2005. Earnings during this same period have been a bit erratic but have increased from $.59/share in 2001 to $1.64/share in the trailing twelve months (TTM). During the past few years, free cash flow has also expanded from $43 million in 2003 to $97 million in the TTM.
The balance sheet per Morningstar looks adequate if not overwhelmingly strong; showing $80.1 million in cash, and $222.3 million in other current assets, fairly evenly balanced against $160.8 million in current liabilities and $192.1 million in long-term liabilities.

Reviewing
Yahoo "Key Statistics" on Brady, we can see that this is a large mid cap stock with a market capitalization of $1.92 billion. The trailing p/e is a very reasonable 23.66 with a forward p/e (fye 31-Jul-07) of 17.84. The PEG is a bit rich at 1.48.
Per
Fidelity.com eresearch website on BRC, Brady is in the "Specialty Chemicals" industrial group. Within this group, Brady is priced midway among its peers. At the top of this group is Monsanto (MON) with a Price/Sales ratio of 3.2. This is followed by Sigma-Aldrich (SIAL) at 2.8, Cabot Microelectronics (CCMP) with a price/sales ratio of 2.5, and Brady (BRC), midway at 2.3. Below Brady is Lubrizol (LZ) at 0.7, and Lyondell (LYO) at 0.4.
Going back to Yahoo, we can find that there are 49.34 million shares outstanding and as of 10/11/05, there were 2.70% of the float out short amounting to 1.32 million shares or 5.6 trading days of volume. This looks significant to me!
The company
does pay a small dividend of $.52/share yielding 1.40%. In addition, the company last split its stock in January, 2005, with a 2:1 split.
And the chart? Looking at a
"Point & Figure" chart from Stockcharts.com:
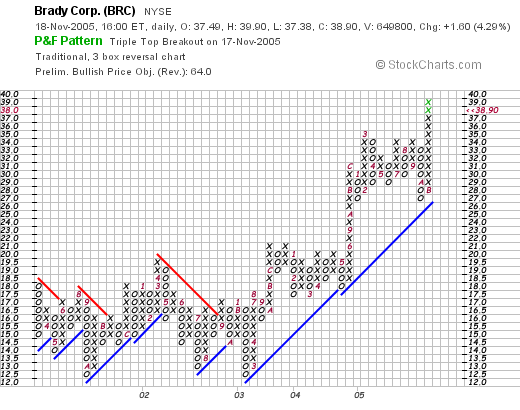
The graph looks quite nice to me. The stock was trading sideways through much of 2001 and 2002, and into early 2003. After bottoming at $12.50 in February, 2003, the stock has been moving higher steadily, staying above its "support line".
So what do I think? Well, the latest quarter was superb, the company also raised guidance, the Morningstar report looks strong, and the chart is excellent. Valuation is reasonable with a moderate p/e, PEG and Price/Sales. I just am not buying any shares as I haven't received a buy signal with any of my 19 holdings, although KYPH and SBUX are both getting close :).
If you have any comments or questions, please feel free to email me at bobsadviceforstocks@lycos.com.
Bob
Posted by bobsadviceforstocks at 6:17 PM CST
|
Post Comment |
Permalink
Updated: Saturday, 19 November 2005 1:07 PM CST
"Revisiting a Stock Pick" Marvell Technology (MRVL)
Hello Friends! Thanks so much for stopping by and visiting my blog,
Stock Picks Bob's Advice. As always, please remember that I am an amateur investor, so please remember to consult with your professional investment advisors prior to making any investment decisions based on information on this website.

Looking through the
list of top % gainers on the NASDAQ today, I came across Marvell, which as I write, is trading at $55.70, up $5.21 or 10.32% on the day. I do not own any shares or options on this stock.
I first
posted Marvell on Stock Picks Bob's Advice on May 21, 2004, when Marvell was trading at $42.99. Marvell actually split 2:1 on 6/29/04,
after my picking the stock, making the effective stock pick price actually $21.50. Thus, with the stock trading as I now write at $56.93 (up a little further since I started writing the post), this is an appreciation of $35.43 or 165% (!) since posting. Too bad I didn't buy any shares either :(.
According to the
Yahoo "Profile" on MRVL, the company "...engages in the design, development, and marketing of semiconductors, such as analog, mixed-signal, and digital signal processing integrated circuits."

What drove the stock higher was an
upgrade on the stock by Prudential. This was on the back of a superby quarterly report. Yesterday, after the close of trading, MRVL
reported 3rd quarter 2006 results. For the quarter ended October 29, 2005, revenue came in at $426.0 million, an increase of 34.1% over the 3rd quarter of fiscal 2005, and a 9.1% sequential improvement over the prior quarter. Net income was $93.0 million or $.29/diluted share, up strongly from $43.65 million or $.15/diluted share the prior year same period.
Looking longer-term at the
Morningstar.com "5-Yr Restated" financials on MRVL, we can see the steady revenue growth from $0.1 billion in 2001 to $1.4 billion in the trailing twelve months. Earnings have also steadily and dramatically grown from $(1.82)/share in 2002 to $.77/share in the TTM. Free cash flow has dramatically improved from $12 million in 2003 to $252 million in the TTM. The balance sheet is also gorgeous with $847.1 million in cash alone, enough to pay off both the $231.4 million in current liabilities and the $119.2 million in long-term liabilities combined more than twice over. In addition, MRVL is reported to have $409.6 million in other current assets.
Looking at the
Yahoo "Key Statistics" on MRVL, we can see that this is a large cap stock with a market capitalization of $16.16 billion. The trailing p/e is definitely rich, but the forward p/e (fye 31-Jan-07) isn't bad at 37.04, and the PEG with the rapid growth in this stock, actually coming in at a reasonable 1.09.
Yahoo reports 283.37 million shares outstanding with 9.24 million out short or 4.30% of the float. However, the short ratio is only 2.5 meaning the trading volume is such, that from my perspective, this is not a significant short interest. No cash dividend is paid, and as noted earlier, the company last split its stock in June, 2004.
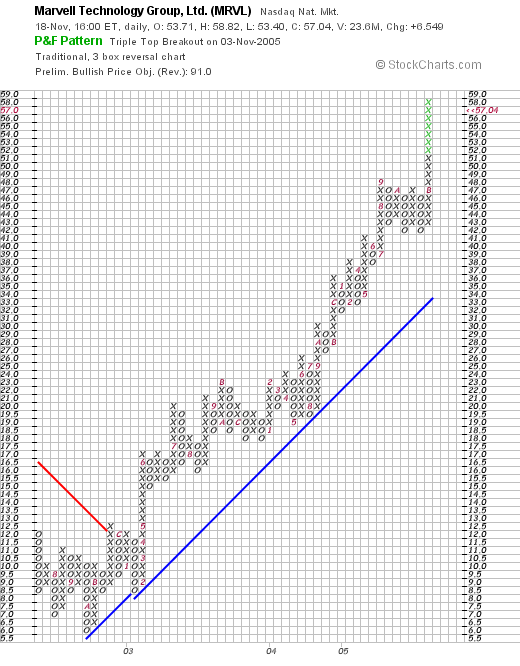
The "Point & Figure" chart on MRVL from Stockcharts.com is a thing of beauty! This is an extremely strong stock, that last broke through resistance in late 2002 at around the $12 level. The stock has subsequently charged ahead unhindered to its current level, and does not appear to be looking back!
What do I think? Well, I like this stock a lot. It is priced for perfection, but on the other hand, as it continues to deliver perfection, the stock price continues to charge ahead. The Morningstar.com picture is beautiful, the chart is nice, and valuation, while rich, may well be justified with the fantastic record of growth.
Thanks so much for stopping by! If you have any questions or comments please feel free to leave them on the blog or email me at bobsadviceforstocks@lycos.com.
Bob
Posted by bobsadviceforstocks at 11:08 AM CST
|
Post Comment |
Permalink
Updated: Saturday, 19 November 2005 1:12 PM CST
Wednesday, 16 November 2005
November 16, 2005 Gilead Sciences (GILD)
Hello Friends! Thanks so much for stopping by and visiting my blog,
Stock Picks Bob's Advice. As always, please remember that I am an amateur investor, so please remember to consult with your professional investment advisors prior to making any investment decisions based on information on this website.

I was looking through the
list of top % gainers on the NASDAQ today, and came across Gilead Sciences Inc. (GILD), which closed at $55.63, up $3.99 or 7.73% on the day. I do not own any shares nor do I have any options on this stock.

According to the
Yahoo "Profile" on Gilead, the company is "...a biopharmaceutical company, engages in the discovery, development, and commercialization of therapeutics for patients suffering from life-threatening diseases primarily in North America, Europe, and Australia. It focuses its research and clinical programs on anti-infectives."
What drove the stock higher today, was the
announcement of the settlement with Roche over Tamiflu (oseltamivir phosphate), one of the main medications possibly effective against avian influenza. Gilead was responsible for the invention of Tamiflu and licensed its production to Roche in 1996. As
further reported:
Gilead will accept a revised royalty structure and a co-promotion option and will receive $80 million in additional royalty payments for prior Tamiflu sales. The royalty rate rises to a range from 14% to 22%, up from approximately 7% to 20%, according to Piper Jaffray.
In addition, Tamiflu royalties will now be based on increasing sales; previously it was a function of sales as well as cost of goods sold (COGS).

Demonstrating timeliness of this entire situation, was the
report today:
(AP) China confirmed its first two human cases of bird flu on the mainland Wednesday, including at least one fatality, as the government raced to vaccinate billions of chickens, ducks and other poultry in a massive effort to stop the spread of the virus.
The government suspected a third case of bird flu in a 12-year-old girl who died, but her body was cremated before it could be tested.
The worldwide demand for Tamiflu medication is difficult to measure, but it is immense. As
reported on Bloomberg last week:
Roche said today that it will charge 15 euros ($17.65) for a 10-capsule course of its antiviral drug in richer nations, and 12 euros in less developed nations. More than 150 third parties are interested in gaining licenses to make Tamiflu under license, the company said earlier this week.
And due to worldwide demand for Tamiflu, the number of dosages being ordered by governments worldwide is rather amazing. Roche is ramping up production as fast as it can. As
reported on November 9, 2005:
In a clear bid to ease the pressure, the normally highly secretive Roche has been revealing increasing amounts of detail about its production process and capacity.
Earlier this week, it disclosed that in 2007, its annual output will reach 300 million treatment courses of Tamiflu a year.
On Wednesday it went a step further, disclosing publicly for the first time previous, current and future output capacities.
Production has been ramped up from 5.5 million treatment courses in 2002 to 18 million in 2003, 27 million in 2004 and 55 million this year, said Jan van Koeveringe, head of technical operations for the global pharmaceutical team.
The company will be able to produce 150 million treatment courses in 2006 and reach 300 million a year in 2007, he said.
Go ahead. You do the math!

But just as important for this blogger, the company fits into our criteria of selecting a stock.
On October 18, 2005, GILD
announced 3rd quarter 2005 results. For the quarter ended September 30, 2005, total revenues came in at $493.5 million, up 51% from total revenues of $326.2 million for the third quarter of 2004. Income for the quarter was $179.2 million or $.38/diluted share. This was up from net income of $113.2 million, or $.25/diluted share in the same quarter the prior year. This was a solid quarter even
without the just announced Tamiflu news!
How about longer-term? Looking at the
Morningstar.com "5-Yr Restated" financials on Gilead, we can see the steady, and impressive growth in revenue from $.2 billion in 2000 to $1.6 billion in the trailing twelve months (TTM). Earnings have been a bit erratic with $(.16) reported in 2000, turning profitable in 2001 and 2002, then dropping back to a loss of $(.18)/share in 2003. Since then, earnings have increased very dynamically to $1.24/share in the TTM.
Free cash flow, while also a bit erratic, has recently increased strongly from $57 million in 2002 to a significant $753 million in the TTM!
The balance sheet is
gorgeous with $1.8 billion in cash and $595 million in other current assets balanced against $261.2 million in current liabilities and $34.2 million (!) of long-term debt.

Taking a look at some
"Key Statistics" from Yahoo on Gilead, we can see that this is a large cap stock with a market capitalization of $25.47 billion. The trailing p/e is a bit rich at 40.46 (but with the current and anticipated growth....will this matter?) and the PEG as reported by Yahoo is also a bit rich at 1.70. But I still wonder what earnings will do with just the Tamiflu deal alone.
According to
Fidelity.com eresearch website on GILD, the stock is in the "Biotechnology" industrial group, and is rich in valuation on a Price/Sales ratio basis within this group. Topping the group is Genentech (DNA) with a Price/Sales ratio of 17.1. Gilead (GILD) follows at 13.7, then Amgen (AMGN) at 8.5, Medimmune (MEDI) at 7, and Biogen Idec (BIIB) at 6.3. Even so, I still find it difficult to properly price the sales potential on this particular stock. (I think I have been overwhelmed by this one ;), all sense of rational thought is being blown away!).
Looking back at Yahoo for some additional numbers, we find that there are 457.92 million shares outstanding with 10.06 million (as of 10/11/05) out short representing 2.8 trading days of volume or 2.20% of the float. This doesn't look very significant to me.
No cash dividend is paid and the last stock split was last year on 9/7/04 when the company split 2:1.
What about a chart? Looking at a
"Point & Figure" chart from Stockcharts.com:
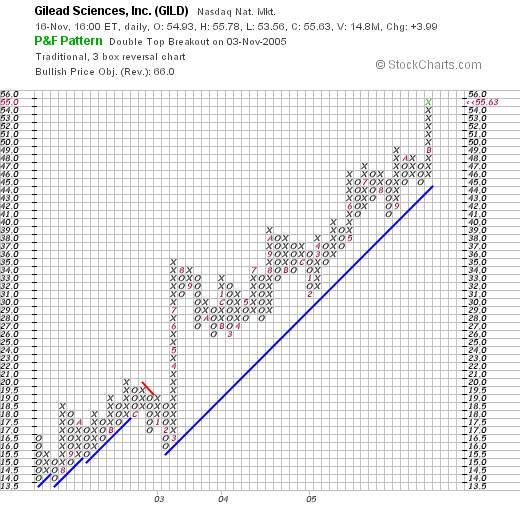
We can see a very strong chart with the stock climbing from $4.00/share in July, 2002, to the current $56 level. the stock has not broken down and continues to barrel ahead strongly!
So what do I think? Well, I could say I was infatuated, but maybe I am just "in love" :). Seriously, the news on this stock is rather strong, with the profit potential of this licensing deal with Roche impressive. Underlying this, the company has strong fundamentals with a great last quarter report, fabulous Morningstar.com evaluation with steady five year results, strong and growing free cash flow, and an impeccable balance sheet. The chart as noted is beautiful.
Only going against this stock is a PEG over 1.0, a P/E in the 40's, and a Price/Sales near the top of its group.
I like this stock in spite of all that. And if only I had a buy signal from my own portfolio, this is the kind of company I might be purchasing! Thanks so much for stopping by. I hope I didn't get too melodramatic on this particular stock pick. Remember, the valuation of this stock is rich and is priced for perfection. However, if perfection should arrive.....well you know the rest of the story! If you have any questions or comments, please feel free to leave them on the blog or email me at bobsadviceforstocks@lycos.com.
Bob
Monday, 14 November 2005
A Reader Writes, "I was wondering if you might take a look...."
Hello Friends! Thanks so much for stopping by and visiting my blog,
Stock Picks Bob's Advice. As always, please remember that I am an amateur investor, so please remember to consult with your professional investment advisors prior to making any investment decisions based on information on this website.
I received a comment over on my Xanga "shadow site" as I call it, and thought I would share it with all of you.
"Moneyundercover" wrote:
Bob,
just started reading your site, but you seem to be suscribed to by many.
I was wondering if you might take a look at MCZ and ATVI for this upcoming holiday season/ xbox release time.
Posted 11/13/2005 at 6:31 PM by moneyundercover
First of all, I cannot be a reviewer of every stock that people have. But in this case, let me take a peek at these two issues and see if they have the kind of characteristics that I find compelling when evaluating investments.
Let's take these one at a time :).

First MCZ. I have never even heard of this stock. But apparently this is the symbol for Mad Catz Interactive. The stock closed today at $.91, up $.07 or 8.33% on the day.
First of all, I avoid like the plague these penny stocks under $1.00. They are generally quite volatile and of lower quality than stocks $10 or higher. But let's proceed with as open a mind as possible :).
According to the
Yahoo "Profile" on Mad Catz, the company "...engages in the manufacture, distribution, and marketing of peripherals for the interactive entertainment industry. Its video game accessories and software are marketed under the Mad Catz and GameShark brnad names. The company produces aftermarket peripherals and accessories for the Nintendo Game Boy Color and Game Boy Advance, Nintendo 64, Sony PlayStation and PlayStation 2, Sega Dreamcast, and the Xbox."
Next, what about the latest quarter? MCZ
reported 2nd quarter 2006 results on November 3, 2005. For the three month ended September 30, 2005, net sales were $23.7 million, a 14.9% increase from the $20.7 million reported last year. The company reported a net loss of $(1.2) million or $(.02)/diluted share, compared to a net income of $.3 million or $.01/diluted share in the same period last year. Thus, even though revenue is growing, earnings are off and the company is not currently profitable.
Interestingly, the company
does have a
"5-Yr Restated" financials on Morningstar.com. During the past few years, revenue has grown from $58 million in 2001 to $112 million in 2005. Earnings have improved from a loss of $(.53)/share in 2001 to $.08 in 2005, but as noted above, have turned back to a loss in the latest quarter.
Free cash flow has also been a bit more optimistic with $(8) million in 2003, improving to $2 million in the trailing twelve months (TTM).
The balance sheet is also reasonable with $1.6 million in cash and $43.1 million in other current assets, balanced against $31.4 million in current liabilities and
no long-term debt.
And what about a chart? Looking at the
"Point & Figure" chart on MCZ from Stockcharts.com:
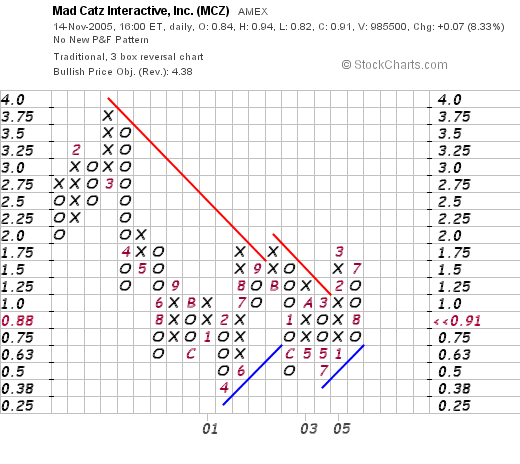
I can't tell you much as the current technical piture looks rather bearish although the stock did break through resistance at $1.00. This is not a convincing graph suggesting a strong upward move.
In summary, I don't like stocks under $10, or at least close to $10 anyhow. The latest quarter shows strong revenue growth but the company turned to a loss, instead of growing its profits as I would prefer. Otherwise, the Morningstar.com doesn't look bad. The chart looks mediocre at best. You might make a lot of money on this stock if Xbox 360, etc., turns out great. That would be your speculation and could be a wonderful stock pick. But as for me, it doesn't fit into my rather rigid approach. Hope that was helpful!
Let's look at the other name you gave me to check.
 ATVI is the symbol for Activision, a company that I at least recognize. I do not have any shares in either of these concerns.
According to the Yahoo "Profile" on ATVI, the company "...publishes interactive entertainment software products. It maintains a portfolio of products that spans various categories and markets, and is used on various game hardward platforms and operating systems." ATVI closed at $17.09 today, up $.40 or 2.40% on the day. At least this stock trades over $10 :).
On November 2, 2005, Activision reported 2nd quarter 2006 results. Net revenues came in at $222.5 million, down from $310.6 million. Net loss for the quarter was $(13.2) million or $(.05)/share compared with net income of $25.5 million last year or $.09/diluted share last year in the same period. Thus, not only did revenue drop significantly from the prior year, but the company also turned from a profit to a loss. However, the company did increase FY2006 revenue outlook and did beat already lowered expectations for the quarter.
Looking at the Morningstar.com "5-Yr Restated" financials on ATVI, we can see the steady growth in revenue from $.6 billion in 2001 to $1.4 billion in 2005. Except for the latest quarter, the company has been fairly steadily increasing both revenue and earnings.
Free cash flow has also been strong, with $79 million in 2003 reported expanding to $195 million in the trailing twelve months (TTM). Also, the balance sheet looks strong with $785.9 million in cash and $283.9 million in other current assets balanced against $154.0 million in current liabilities and only $.1 million in long-term liabilities. This is a very strong balance sheet!
What about a chart? Looking at the "Point & Figure" chart on Activision from Stockcharts.com
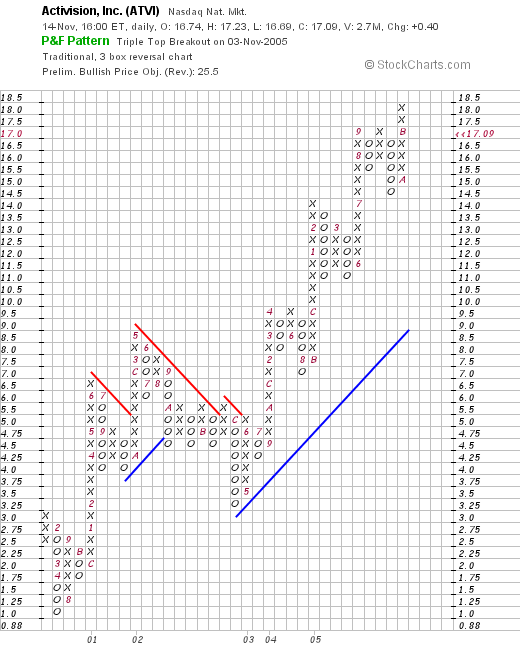
We can see what looks like to me to be a very strong price appreciation in ATVI stock. Since April, 2000, when the stock bottomed at around $1/share, the stock has moved almost perfectly higher to the current $18.50 level.
So what do I think about these two stocks? Well, they are a bit too speculative for me :(. First of all, both of them reported losses in the latest quarter. I am extremely "picky" about stocks, and insist on expanding profits in the latest quarter. In addition, MCZ is a "penny stock" trading under $1/share. This makes it also quite speculative. As far as ATVI goes, the company in the latest quarter showed a sharp drop in revenue, showing the cyclical nature of these game companies, but did raise guidance. Of the two ATVI appears to be a higher "quality" selection, but neither fit my criteria here. That doesn't mean that they aren't going to possibly appreciate in price. It just means that it didn't make my cut.
Thanks so much for writing. Good luck with your stocks and keep me posted as to how everything turns out. I hope my discussion was helpful for you! If you have any other questions or comments, please feel free to leave them on the blog or email me at bobsadviceforstocks@lycos.com. I cannot get to every email or comment, but I shall try to get to as many as possible, commenting usually right on the blog.
Bob
Posted by bobsadviceforstocks at 10:38 PM CST
|
Post Comment |
Permalink
Updated: Monday, 14 November 2005 10:44 PM CST
"Revisiting a Stock Pick" DJ Orthopedics (DJO)
Hello Friends! Thanks so much for stopping by and visiting my blog,
Stock Picks Bob's Advice. As always, please remember that I am an amateur investor, so please consult with your professional investment advisors prior to making any investment decisions based on information on this website.

Looking through the
list of top % gainers on the NYSE today, I saw that DJ Orthopedics (DJO), an old pick of mine, was on the list today. DJO is trading at $31.35, up $.95 or 3.13% on the day as I write.

I first
posted DJ Orthopedics (DJO) on Stock Picks Bob's Advice on August 22, 2003, when it was trading at $10.89. The stock has thus appreciated $20.46 or 187.9% since posting. Unfortunately, I do not own any shares or options on this company.
According to the
Yahoo "Profile" on DJO, the company "...engages in the design, manufacture, and marketing of surgical and nonsurgical products that repaid, regenerate, and rehabilitate soft tissue and bone, help protect against injury, and treat osteoarthritis of the knee."
On October 27, 2005, DJO
reported 3rd quarter 2005 results. Net revenues for the quarter ended October 1, 2005, increased 15.5% to $72.1 million, up from $62.5 million in the same quarter last year. Net income grew 61.4% to $7.5 million or $.33/share up from $4.7 million or $.20/share in the third quarter of 2004.
Looking longer-term at the
Morningstar.com "5-Yr Restated" financials on DJO, we can see that since 2000, revenue has grown steadily from $143.6 million to $269.6 million in the trailing twelve months (TTM). Earnings improved from a loss of $(.85) in 2002, increasing to $.64/share in 2003, dipping to $.63/share in 2004, and have grown strongly this past year to $1.05/share int eh TTM.
Free cash flow has also been improving steadily the last few years with $11 million reported in 2002, improving to $36 million in the TTM.
The balance sheet looks reasonable with $6.2 million in cash and $86.3 million in other current assets...plenty to almost cover both the $32.5 million in current liabilities and the $65.2 million in long-term liabilities.
Checking some
"Key Statistics" from Yahoo on DJO, we find that this is a small company with a market capitalization of only $691.00 million. The trailing p/e is a moderate 26.89 with a more reasonable forward p/e of only 21.50. The reported "5 yr estimated" PEG comes at 1.71. However, with the strong latest quarter, I am not sure this figure takes that result into consideration.
Using the
Fidelity.com eresearch website to get a better 'feeling' on the value of DJO relative to other companies within its industrial grouping of "Medical Appliances/Equipment", we can see that the Price/Sales ratio is quite reasonable within its group.
Leading the group is St. Jude (STJ) with a Price/Sales ratio of 7.1, followed by Medtronic (MDT) at 6.7, Zimmer Holding (ZMH) at 5.2, Biomet (BMET) at 4.9, and Edwards Lifesciences (EW) at 2.7. At the bottom of the list, representing the best value in regards to this parameter, is DJ Orthopedics (DJO) with a Price/Sales ratio of only 2.50.
Reviewing some more numbers from Yahoo, we find that there are 21.87 million shares outstanding. as of 10/11/05, there were 1.60 million shares out short, representing 7.40% of the float or 9.1 days of trading volue. Using my own '3 day rule' on short interest, this looks significant to me imho.
No cash dividend and no stock dividends are reported on Yahoo.
What about a chart? Taking a look at the
Stockcharts.com "Point & Figure" chart on DJO:
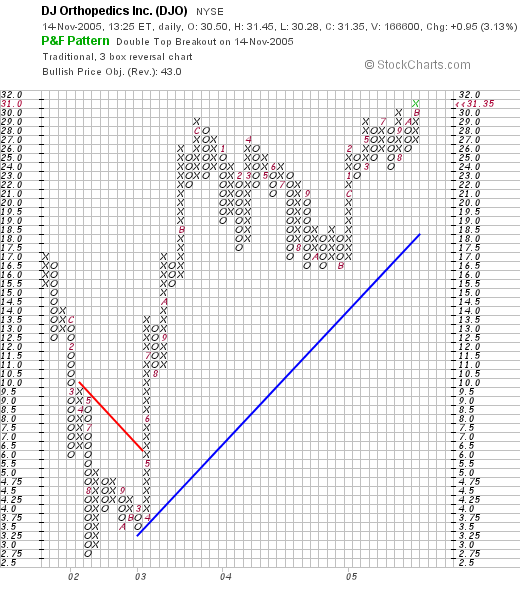
The chart currently looks strong. The stock declined sharply from $17 in late 2001, dropping to a low of $2.75 in August, 2002. From there the stock broke through its resistance line in May, 2003, and hasn't looked back, charging higher to the $31 level. This looks like a strong chart to me!
So what do I think? The stock looks very attractive to me. Valuation is reasonable in light of the small size and quick growth in earnings, the latest quarterly report was quite strong, the Morningstar.com wasn't quite perfect, but still looked quite good for the past few years, and valuation is reasonable. On top of all of this, the chart looks encouraging as well.
Now, if only I had a signal that I could be buying shares of stock :(. Oh well, thanks again for stopping by and visiting. I hope that my discussions are helpful to you in thinking about stocks. Be sure to explore the links in each article. And if you have any comments or questions, please feel free to leave them on the blog or email me at bobsaviceforstocks@lycos.com.
Bob
Newer | Latest | Older


